GeoMentor Justin Shedd Leads Local Classroom to Explore Mapmaking with ArcGIS Online
Various school groups have visited the Center for Geospatial Analytics to explore its innovative tools and technologies. This semester, a local science teacher contacted the center to request a guest speaker who could bring their expertise in spatial problem-solving to his classroom. “We’re wrapping up a unit on mapping,” wrote Joe Brinkman, a teacher at Thales Academy in Apex. “I wanted the kids to be able to see that there is more to maps out there in the real world, utilizing some cool technology these days.” Research Associate Justin Shedd answered the call.
Specializing in GIS for wildland fire management at the center, Justin has been volunteering in his own children’s elementary school classrooms for several years and also participates in the GeoMentor program run by the American Association of Geographers and Esri. Finding a way to meet Joe’s request was a natural fit for him. “I’m very happy to have had Justin in to our classes,” Joe reports. “The kids had a great time.”
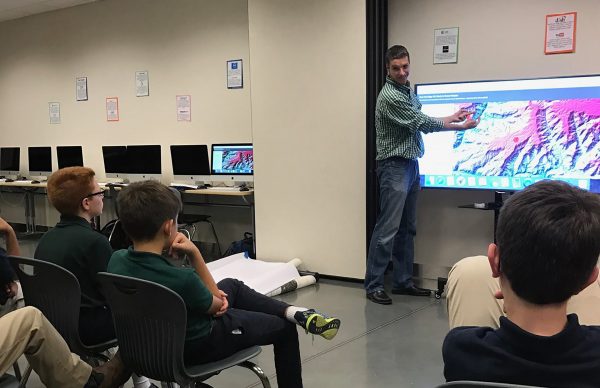
For the over 50 sixth- and seventh-graders in Joe’s classes at Thales, Justin led a discussion of digital mapmaking and helped the students understand what maps can convey and what questions they can answer. “All maps tell a type of story,” Justin says. With ArcGIS Online, he was able to show the students different kinds of interactive maps and how to create their own. He particularly encouraged them to take advantage of troves of publicly available datasets to create their maps. The result was a variety of unique applications: Some students chose to map the locations of their favorite food chains, with data embedded to show hours of operation and other info, while other students used data from the Town of Apex to view the spatial arrangement of polling places or infrastructure such as utility lines.
Justin also led a demo showing how to perform analyses with the maps, “doing something with the data” in addition to simply looking at it, he explains. For example, the class discussed the concept of buffers and analyzed how far a person could walk or drive within a one- or two-mile buffer around a point on the map. “It wasn’t overly nerdy but it doesn’t need to be,” Justin says. Recalls Joe, “The kids really enjoyed getting to see some of the details and information that maps could provide. Getting to make their own maps was also exciting for them. It wasn’t something they expected to enjoy as much as they did and that was my goal.”
Thanks to Justin for volunteering his time and providing a great classroom experience!
- Categories: