Real-World Problem-Solving with Custom GIS Solutions

The Center for Geospatial Analytics is celebrating the December 2018 graduation of sixteen professional master’s students in Geospatial Information Science and Technology (MGIST)! During their final semester, each student in the MGIST program completes a service-learning capstone project, working directly with a community or industry partner to apply their knowledge and skills to a real-world problem. Service learning differs from community service in that students work collaboratively with their external partner to solve a problem together. In the process, everyone learns.
This semester, capstone topics ranged from demystifying undersea volcanoes to helping would-be composters, mapping school violence, tracking songbirds, highlighting traffic congestion, supporting military mapmaking and more. Read on for a glimpse into the exciting work of our professional master’s students!
Demystifying undersea volcanoes

Volcanoes on the ocean floor are a lot more active than volcanoes on land, but because they’re underwater, they are more difficult to study. In partnership with Center for Geospatial Analytics Faculty Fellow Paul Byrne (assistant professor in the Department of Marine, Earth and Atmospheric Sciences), MGIST student Rebecca Hahn developed a novel methodology and web application to identify and analyze the characteristics of volcanoes along undersea ridges where the Earth’s tectonic plates are spreading apart.
“The rate of plate movement plays an important role in determining the type of volcano that forms and the rate of eruptive activity,” Rebecca says. “It is important to understand deep sea volcanic process to gain better insight into potentially destructive eruptions in shallow water on Earth and to better understand volcanic processes on other planetary bodies.” For her project, she examined 700 volcanoes along Earth’s East Pacific Rise, where the crust is spreading apart at 6–15 cm per year, and the Mid Atlantic Ridge, a more slowly spreading plate boundary with movement of only 2.5 cm per year. Volcanoes at the ridges varied in age from 10 to 180 million years old.
“I basically developed a methodology for going in, finding volcanoes on the ocean floor using contour lines and bathymetric data and then…calculating all of the morphological properties for each of those volcanoes,” Rebecca says. She created the web application “to generate a comparative statistical report for the morphological properties at each ridge based on volcano ages.” And her findings? “The older, further [from the ridge] volcanoes were generally larger, which isn’t something we were expecting and it happened at both ridges, so that was a pretty interesting discovery.”
Rebecca is planning to continue this work through more graduate research, extending her focus to volcanoes on the surface of Venus, where a thicker atmosphere creates higher pressure at the planet’s surface. “Volcanoes on Venus and a kilometer [down] on the [Earth’s] ocean floor exist at the same pressure,” she says. She credits her capstone project with “giving me the foundation to move forward with other projects that I want to work on.”
Making it easier for anyone to compost
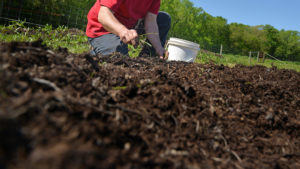
Recycling lawn, garden and food scraps into nutrient-rich compost is a great way to keep these materials out of landfills and return important organic matter to soil, but it’s not always straightforward to find local facilities that accept compostable waste or sell finished compost. To address this problem, MGIST student Sabina Bastias partnered with the national nonprofit US Composting Council to create an online application featuring the nationwide locations of compost manufacturers and distributors.
“Prior to development of this application,” Sabina says, “those interested [in composting] would have had to manually search the internet hoping to find a reliable source [of information] or browse through the US Composting Council’s website in order to find information. Now, in this application, not only do they see reliable resources, they can do a comparison based on their location.” Sabina started with an Excel spreadsheet and worked to geocode the data and integrate it into an easy-to-use app. Having developed her capstone project from the ground up, she says, “I think it’s a good example of everything that I learned throughout the program … [I] got to test out my knowledge on everything for the project.”
Mapping school violence

MGIST student Robert Lewis has been a middle school teacher in North Carolina for the past fifteen years, and in that time he has been “a witness to multiple incidents [of school violence] that put everyone at risk.” Partnering with the Information Sharing and Analysis Center of North Carolina’s State Bureau of Investigation, he used data about dangerous incidents at schools from the past two years to distinguish areas of the state with higher incident rates and develop a way to help schools report these threats. The web mapping application he created “can identify and help make the public more aware of the situation in the schools,” he says. Moreover, “Identification of school systems not submitting data will help improve statistics and allocation of resources.”
Tracking the choices of an intriguing songbird

When animals show up in unexpected places, scientists take notice. Case in point: the Black-throated Green Warbler, a small migratory songbird that typically breeds in conifer forests of Canada, the northern US and Appalachian Mountains but has been observed nesting outside of its customary breeding range––in North Carolina’s Uwharrie National Forest. To discover what choices these birds are making at Uwharrie, a research team led by John Gerwin of the NC Museum of Natural Sciences used small radio-transmitters to track a sample of the birds over the course of three breeding seasons. He then provided those location data to MGIST student Madi McDiarmid, who created a web mapping application displaying the individual birds’ home ranges and characteristics of the landscapes they used. “The goal is to be able to collect this information so that we can share it with conservation organizations––so they can make more informed decisions when acquiring land to conserve and protect,” Madi says. While analysis is still ongoing, Madi notes that the birds in Gerwin’s sample “selected the highest available elevations within the forest.”
Keeping ahead of traffic congestion

As North Carolina’s population grows, more crowding on the roadways seems inevitable and public transit may experience delays––unless buses can find ways around the gridlock. MGIST student Trevor Stewart partnered with NC State’s Institute for Transportation Research and Education (ITRE) to find out where buses are getting stuck in traffic and to automate a workflow for identifying traffic congestion hotspots. “The NC Department of Transportation and community transit planners want to know where public bus and school bus systems experience high levels of traffic congestion,” he says. The web mapping application he created “demonstrates how visualizing traffic congestion along bus routes can improve decision-making.” It also allows users to “query the bus route congestion layers by route name, congestion index or number of bus routes per road segment.” With this information, route planners can circumvent problems before they arise.
Streamlining map production for the US Air Force

Weather is an important factor in military operations, and the 14th Weather Squadron of the US Air Force is responsible for producing annual climatology data products that summarize and map conditions across the globe. Annually updating these many map products, however, requires a lot of effort. Partnering with the 14th Weather Squadron, MGIST student and US Air Force Captain Dennis Wallace developed a web mapping application that allows users to explore a multitude of climatology data and generate custom maps at any time using built-in templates. The app “eliminates the requirement to reproduce maps every single year,” Dennis says, because personnel can now produce maps on demand. “This is the first step to creating a user friendly and on-demand interface for the 14th Weather Squadron,” he explains, noting that the Air Force would use their own secure system to recreate the tool. “It’s…a proof of concept, but it shows they can reduce the burden they have every year for creating hundreds of products.”
And more!

Many MGIST students this semester engaged with experts from NC State University, including the Center of Geospatial Analytics, to develop their capstone projects. Dakota Lowery partnered with center research associate Justin Shedd on a project for the National Park Service, developing a web mapping application for the Appalachian Trail that allows firefighters to visualize, and get directions for, routes between fire stations and access points along the trail. Jason White collaborated with ITRE on a project for NCDOT’s Affordable Housing Action Group, identifying NCDOT-owned parcels that may be suitable for affordable housing development. Chad Dyke worked with the JC Raulston Arboretum to create a web mapping application that uses route modeling to create self-guided walking tours to plant species of interest at the arboretum.
Some capstones even expanded on the work of students in previous semesters. Sarah Vincent continued the work of a May 2017 graduate studying historical patterns of oyster consumption in Manhattan. Working with NC State’s Department of History professor Matthew Booker, Sarah explored the origins of oysters eaten in New York City restaurants between 1862 and 1960 and created a story map complete with historical photos to document the spatial relationships between supply and demand. “This is really remarkable as a dataset because it’s big data,” Booker says. “Most food historians don’t connect production and consumption, and this does.” Cristian La Rosa continued the work of two May 2018 capstone projects with the Hinton Rural Life Center in Hayesville, NC, mapping resources available to rural communities and adding new functionality to a web mapping application to incorporate feedback from users. Betsy Bouton continued the work of a December 2017 graduate with the NC Housing Coalition to assess housing affordability across the state.
Several students this semester focused on forest management for their capstones. Bill Wollman partnered with Resource Management Service and WithersRavenel to help forest managers assess the effectiveness of strategies to control competing vegetation in pine plantations using remotely sensed data. Christopher Harrell developed a method to better classify tree canopy from high-resolution imagery for the NC Department of Agriculture and Consumer Services.
Projects also supported the missions of local companies. Kaila Gillespie developed a web mapping application to help CBRE | Raleigh, a commercial real estate service, determine the best sites for new businesses based on multiple data sources. Kyle Tobin partnered with his own employer to advance the data collection efforts of Wadelynn Geospatial and transform some of their workflows from paper-based to digital; the web mapping application he developed “provides real-time data collection that can be shared between employees in the field and in the office,” he says. “The geoprocessing tasks allow for quick answers in the field.”
Congratulations to all of our graduating MGIST students on their success!