The Art of Storytelling, with Geospatial Data

Words and data points have a lot in common: when combined in new ways, they can tell richly informative stories about what is happening in the world.
As both a writer and a data scientist, Geospatial Analytics doctoral student Nikki Inglis understands the connection between data and storytelling better than most. Her dissertation research bridges geospatial science and public policy, and her background in journalism has uniquely prepared her for both making and sharing discoveries.
“Writing and data analysis both involve doing research and finding the connections,” she says. “Maps don’t just tell us where we are; they tell us how things are as well.”
Inglis came to NC State in Fall 2018 as one of the first students in the newly launched Geospatial Analytics Ph.D. program, with Faculty Fellow Jelena Vukomanovic as her advisor. Working at the intersection of technical data analysis and human dimensions, “where all of the things that I love kind of meet,” she says, particularly appealed to her.
Inglis’s journey to the Ph.D. program was unique. For five years after college, she worked as a staff writer for several newspapers, including the Steamboat Pilot in Steamboat Springs, CO, for three years. “I really wanted to write about the environment, climate change, science,” she says, but she knew that the newsroom was not where her ultimate career lay.
And so she left her newspaper job to pursue a master’s degree that integrated science and environmental policy, with a geospatial twist. “I had a professor that got me completely addicted to GIS and looking at problems at large scales,” she says. Discovering a talent and passion for geospatial data analysis was a game-changer for her. “I feel that I can be much more effective behind a computer than collecting data out in the field,” she says.
Now entering the second year of her Ph.D. at NC State, Inglis says that she “never really left journalism.” Data science and journalism both involve combining information from multiple sources to answer questions, and “there are a lot of parallels,” she says. “Collecting small parts and putting them together into a narrative, into something that is bigger than the sum of the words, than the sum of the data––it’s all about storytelling.”
Telling a data-driven story about fire
Inglis’s dissertation will ultimately focus on combining viewscape analysis and computer simulations to understand how what people can see from roads and homes influences where they live and patterns of development. In particular, she’s interested in how those patterns might affect public lands like National Parks and National Forests.
Over the past year, though, as part of a research assistantship through the Center for Geospatial Analytics, she has had the opportunity to work with research associate Justin Shedd on projects that support the center’s collaboration with the National Park Service (NPS) to use geospatial tools for fire management.
One of NPS’s Wildland Fire Management Values, outlined in the agency’s Wildland Fire Strategic Plan, is to base “planning, implementation and evaluation of the wildland fire management program…on sound science that adds to a common, accurate, and clearer understanding of our current situation and future challenges.” Creating that shared understanding requires clear data visualization and communication.
During several solid months of programming, Inglis built a data visualization tool for managers at Everglades National Park and Big Cypress National Preserve in Florida to examine trends in fire over time, coding the entire system from scratch. She originally began developing the tool in Faculty Fellow Laura Tateosian’s GIS 715 course, “Geovisualization”––part of the Ph.D. program’s core curriculum––and the work expanded from there.
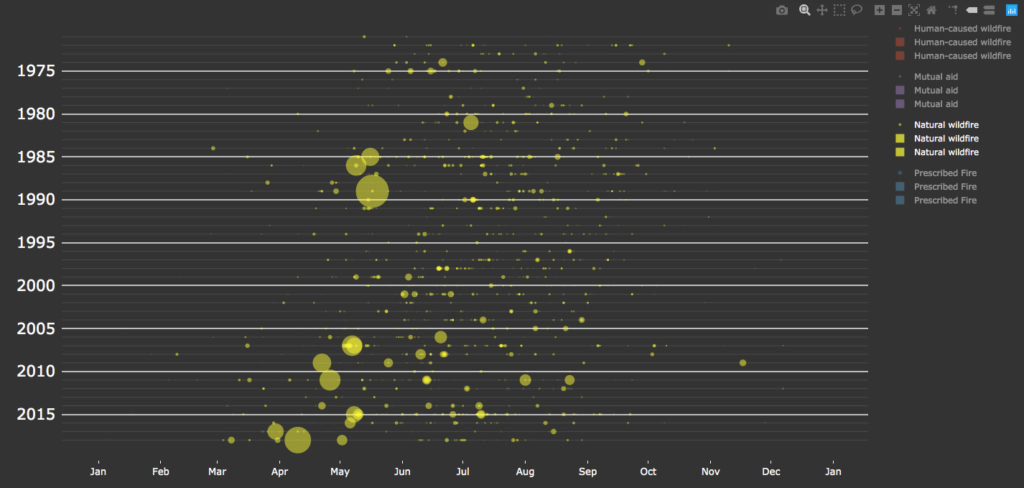
“This is a very rich dataset,” Ingis explains, as it includes information from over 5,000 fires dating back to the 1970s. The web-based, interactive platform she created displays all of that information and essentially “is an experiment, an exploration tool to spark questions that can then be explored using more quantitative techniques.”
The National Park Service has already found it helpful. For one thing, the tool confirms a hunch that fire managers in Florida have had for years: natural wildfires are happening earlier and earlier. While prescribed fires are performed year-round, and human-caused wildfires are becoming less common, the data show a clear natural fire season, which is starting sooner than it used to.
Inglis also incorporated NPS cost information into the tool so that expenses associated with wildfire and prescribed fire can be displayed. “One of the most important factors in the cost of a wildfire is structures, buildings” that must protected by firefighters, Inglis says. Prescribed fires lower the risk of catastrophic wildfires, because they remove fuel such as dry, dead vegetation and are performed under very controlled conditions. Spending money on prescribed fires could therefore lower overall fire management costs, by preventing really expensive (big) wildfires, particularly in Big Cypress National Preserve, where there are a considerable number of private homes.
Going forward, Park Service staff “are going to keep an eye on how prescribed fire influences the occurrence of wild and human-caused fire,” Inglis explains. Her tool will help them to quickly and easily draw connections from data that they have been collecting over the past four decades.
Bringing it all home
Inglis is from Colorado, and her home state has a lot of “moving parts,” she says: public land, private land, large wilderness areas and huge parcels owned by residents. “I ultimately want to take the things that I’m learning and bring it back to this valley I love,” she says. She’s aiming for a career in which she can contribute to both protecting the land and helping people to live on it sustainably.
Data analysis and storytelling will continue to play a large role in that mission. “The really cool thing is that I haven’t had to collect any data for my current research. All the work I’m doing is using data that are already available. It just goes to show how much exploration there still is to do.”
- Categories: