Making Spatial Sense of Public Webcams
Streaming public webcams are abundant in our modern cities, and their imagery can provide rich insights into how we navigate our urban environment. With them, researchers and urban planners can track how many cars, bikes or people pass through a camera’s line of sight at a particular time, revealing the effects of new bike lanes or crosswalks or stoplights on traffic patterns and space use.
What these cameras had not been used to do, however, is provide mappable information about that traffic and space use…until now.
A recently published study from the Center for Geospatial Analytics at North Carolina State University describes a new way to extract geo-located information from webcam images––to produce three-dimensional visualizations of pedestrian density across space and time.
The work, led by geospatial research software engineer Anna Petrasova, builds on previous research at the center showing how crowdsourcing techniques can be used to effectively quantify pedestrians, bicyclists and vehicles in webcam photos. The new work takes that research further by identifying the locations of objects and people within the photos.
“[M]easured distances in webcam images represent varying on-the-ground distances, [and so] many urban webcam studies have been focusing on counts and traffic flows rather than spatial mapping,” Petrasova and her co-authors explain.
Their newly published research, however, takes a different approach: To spatially map pedestrians in webcam images, Petrasova used satellite imagery to georeference their locations in the photos and created what is called a “space-time cube” to visualize changes in density throughout a day or week.
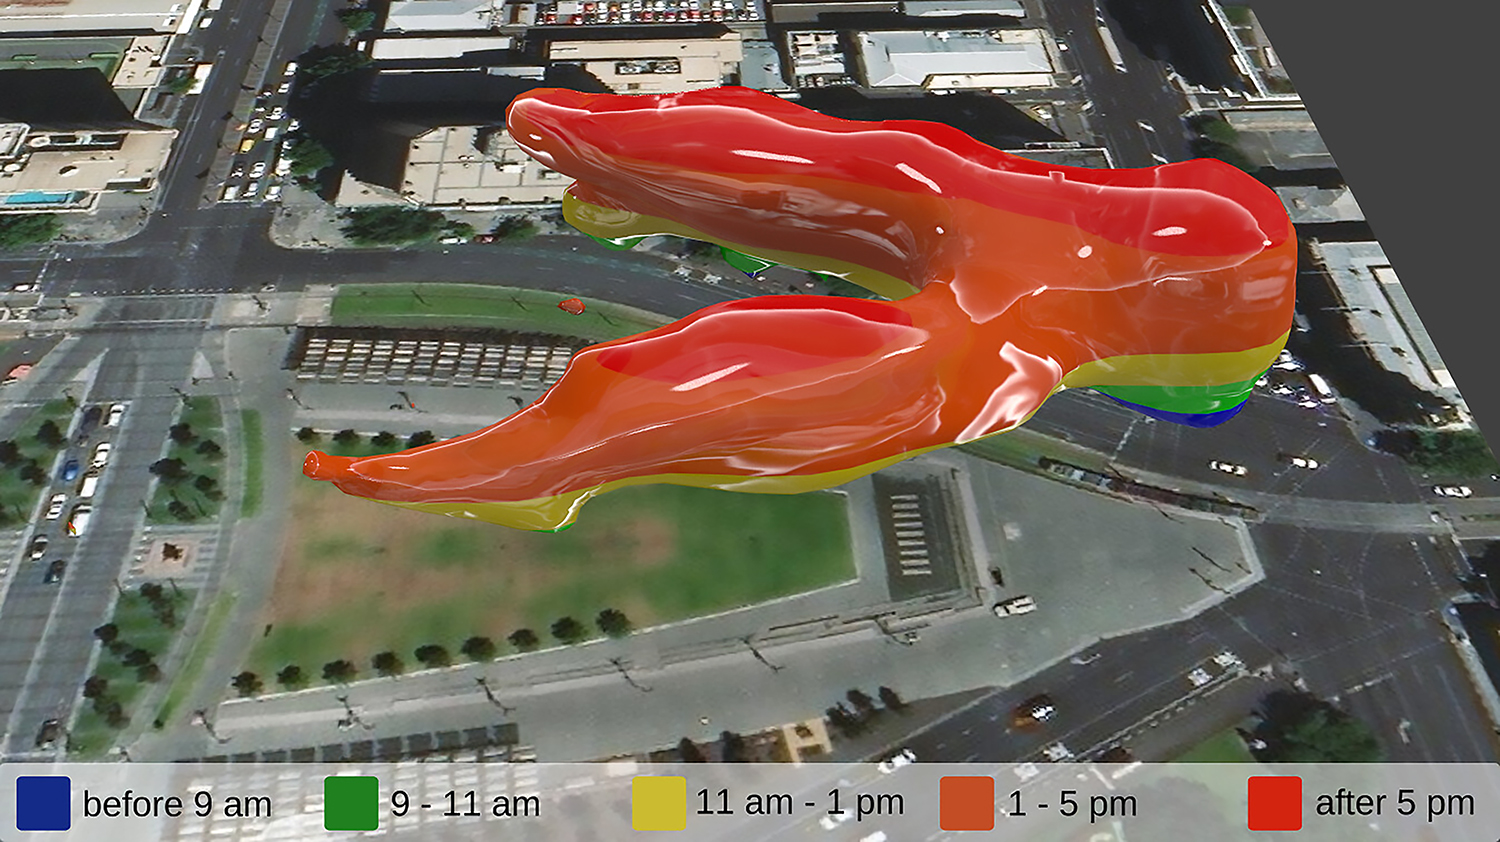
One of these space-time cube visualizations (the featured image above) won first place in the postdocs and grad students category of NC State’s 2018 Envisioning Research Contest. The image depicts pedestrian density in a public plaza (Victoria Square) in Adelaide, Australia, after the plaza was redesigned in 2014 to encourage more foot traffic.
To compare pedestrian use before and after the plaza was redeveloped, the researchers downloaded hundreds of webcam images from the Archive of Many Outdoor Scenes (AMOS), then asked users of Amazon’s Mechanical Turk (MTurk) crowdsourcing platform to draw a box around each pedestrian. Petrasova then used those identifications to determine the spatial position of people in the photos.
The analysis revealed several changes in pedestrian traffic through the plaza: “While the northern part of the plaza has consistently high densities due to the important crosswalk, the densities across the plaza have changed considerably…[with] higher densities on the paved parts of the plaza after its reconstruction,” the team reports.
Their new analytical and visualization method has the potential to inform urban design across the world, including plans aimed at “increasing walkability, reducing traffic congestion or identifying underused infrastructure,” they explain. Importantly, their approach “allows exploration and communication of hourly, daily or weekly spatio-temporal patterns in an efficient and concise way.”
The study was published in the International Journal of Geo-Information as part of its Measuring, Mapping, Modeling, and Visualization of Cities special issue. Petrasova’s co-authors were center faculty fellow Aaron Hipp (Dept. of Parks, Recreation and Tourism Management) and the center’s associate director of geovisualization, Helena Mitasova (Dept. of Marine, Earth and Atmospheric Sciences).