Making Mapping and Modeling More Accessible
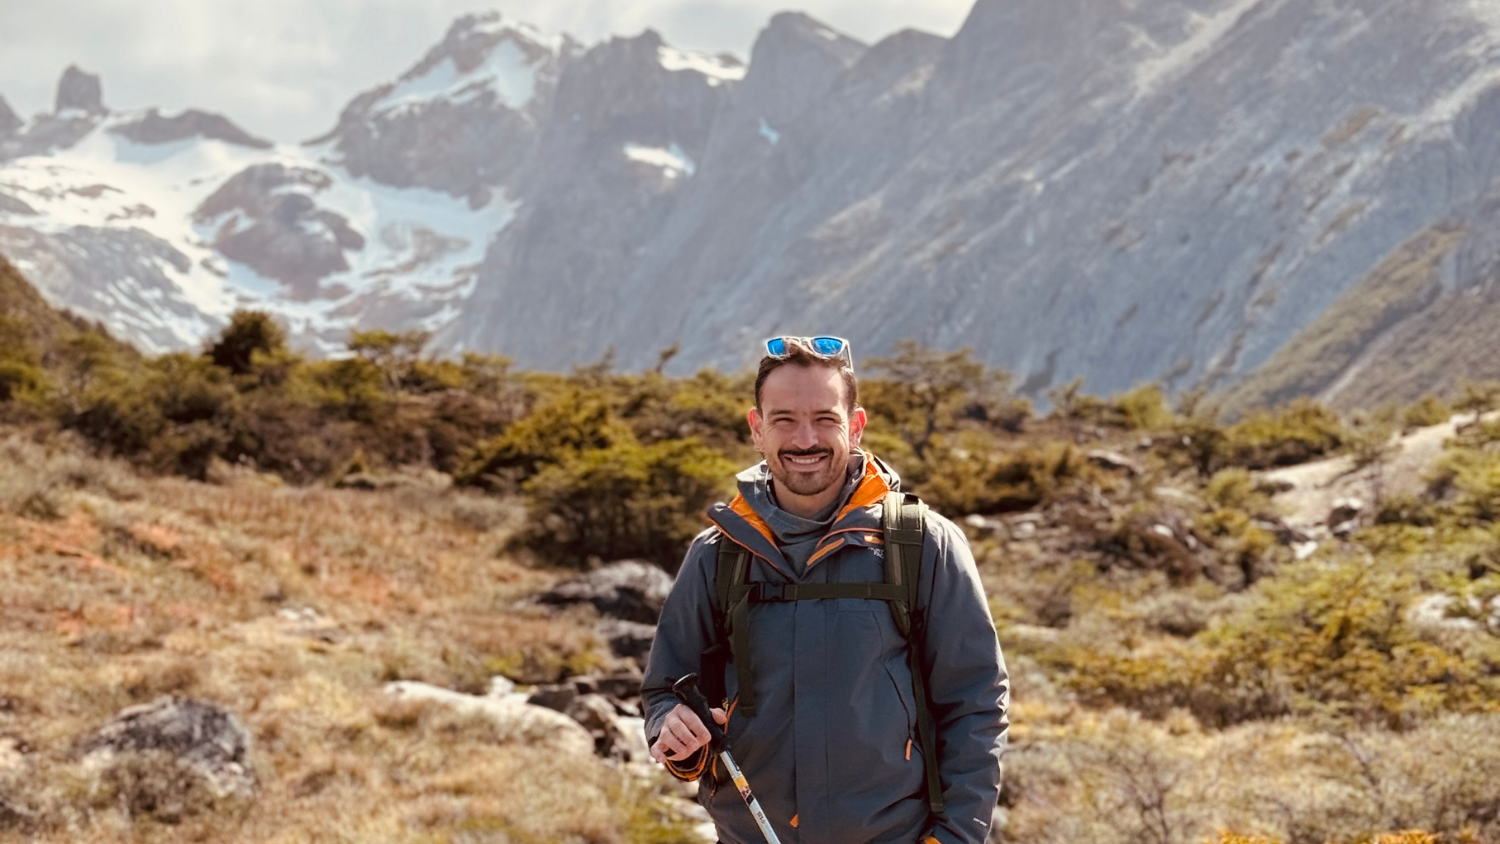
Editor’s note: Each semester, students in the Geospatial Analytics Ph.D. program can apply for a Geospatial Analytics Travel Award that supports research travel or presentations at conferences. The following is a guest post by travel award winner Nick Kruskamp as part of the Student Travel series.
Pests and pathogens pose a growing threat to the health of our nation’s forests. These biological invasions can go undetected for years, killing trees as they spread. Land managers tasked with stopping the spread of these invasive species are often left guessing where the invasion will go next. The Pest or Pathogen Spread (PoPS) model being developed at the Center for Geospatial Analytics aims to provide managers with the best tools available to map biological invasions and predict their future spread. But we’re often missing a vital piece of information–where do trees live that host the invasive species?
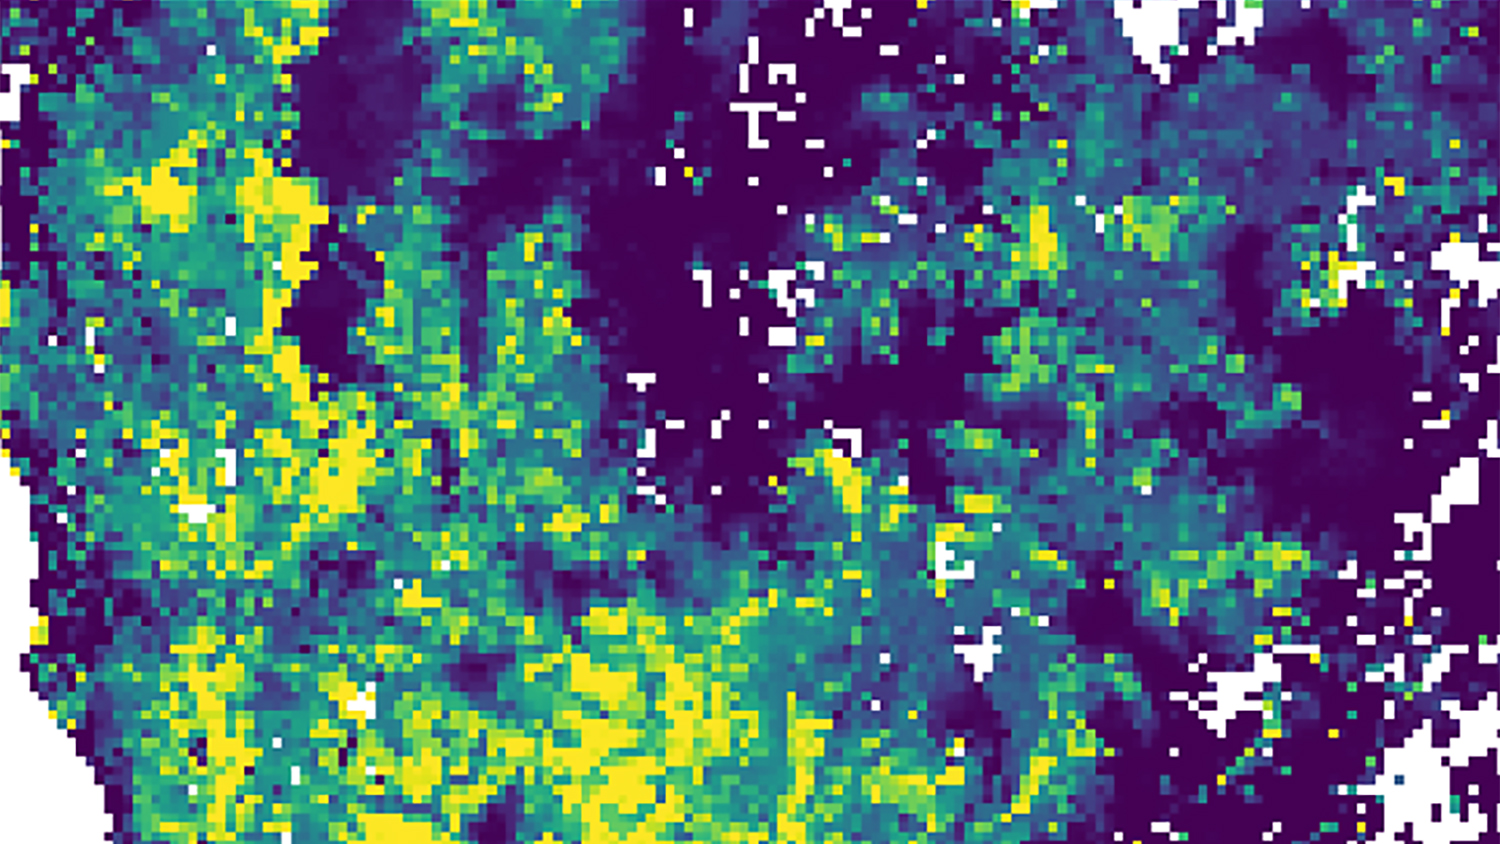
We often take for granted that we know where a tree species lives. For decades, individuals and groups have attempted to map the distribution of plant species in the United States. From hand drawn maps to sophisticated algorithms, many tools have provided good approximations of a species’ range. But what if you need to know with great accuracy where a tree is present (or not)? And what if you need to know how certain you are that the tree exists there? Those are the challenges I address in the work I presented at the American Geophysical Union (AGU) 2019 Fall Meeting in San Francisco, California. My conference session, focused on the need for earth scientists to make interdisciplinary research more accessible to all users, was a perfect fit to highlight our efforts in developing the PoPS model and integrating a species mapping component. In my presentation, I demonstrated how we are simplifying the process of making map data and putting advanced decision analytics in the hands of those who need to make actionable management decisions quickly.
The positive impacts of receiving a travel award and taking full advantage of conference opportunities are hard to overstate. AGU is unique in its size and scope. Research ranging from the Earth’s core to the far-flung reaches of our universe—and everything in between—is presented at AGU. For a graduate student, navigating the conference can feel like an insurmountable challenge. Using tools available to students is a key component of having a successful conference experience, building networks and keeping your sanity. Things like conference presentation feedback and AGU’s mentoring website can AGU make feel a little less intimidating.
This year I was able to build on the relationships I made at the last AGU conference (also made possible by a Geospatial Analytics Travel Award) and make new ones. The convener of my session was someone whom I met last year and have maintained contact with as we share a common goal of understanding how to mitigate the impact of invasive species in forest environments. He encouraged me to submit an abstract to his session, which I would have otherwise missed. Additionally, last year I participated in the Outstanding Student Presentation Award (OSPA) and received great feedback from anonymous reviewers. Taking that feedback into consideration this year, I won an OSPA—given to only 2 to 5% of students who participate in the program each year!
- Categories: