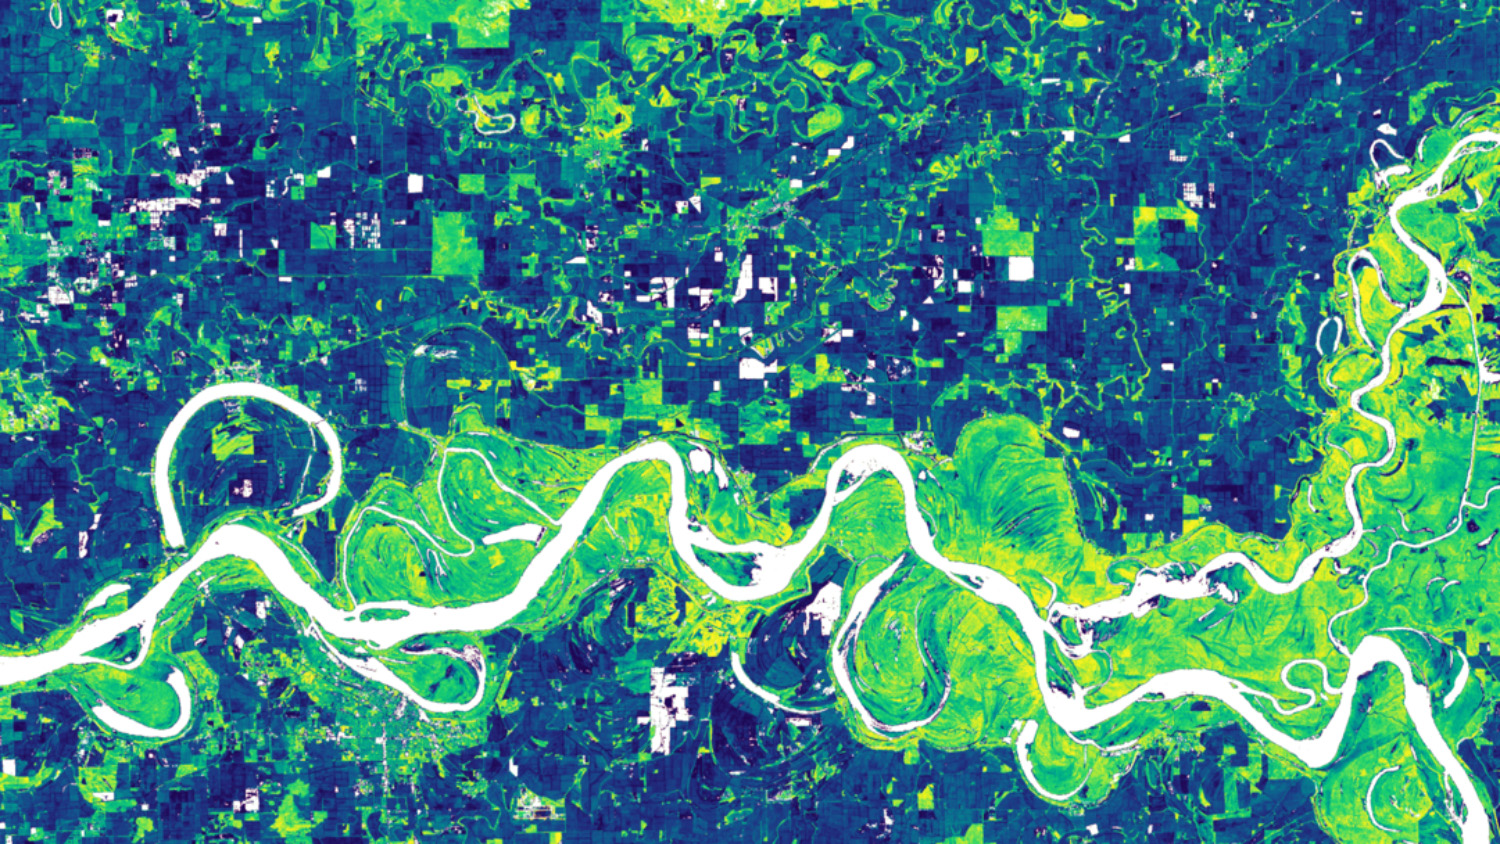
Observing Long-Term Annual Land Surface Phenology at Medium Spatial Resolution

Editor’s note: The following is a guest post by Geospatial Analytics Ph.D. student Xiaojie Gao.
Land surface phenology (LSP) is a measure of plant seasonality made using satellites, and it plays an important role in understanding plants’ responses to climate change. Until now, the LSP products scientists use to understand continent-wide and worldwide changes in plant life cycles have either had coarse spatial resolution or were available only for a few recent years, meaning that important finer-scale spatial patterns and longer-term changes could be missed. I worked with my advisor, Josh Gray, and a Bayesian statistics professor, Brian Reich, to solve this problem. We developed a novel Bayesian LSP model that estimates the timing of plant life cycle events with a 30-m pixel size every year for the past 36 years. To our knowledge, this is the first LSP model with medium spatial resolution and such a long timeframe! (See our published journal paper.)
LSP products have historically been limited by a trade-off between observation frequency and spatial resolution. For example, the most widely used LSP products are based on the MODIS sensor, which was launched in 2000 and provides daily observations but has a 500-m spatial resolution. Imagery from two different satellites, Landsat 8 and Sentinel 2, was recently harmonized to provide observations every three to five days at 30-m scale. However, Sentinel 2 was launched in 2015, so LSP products using this harmonized imagery span only a few years.
Landsat, meanwhile, is the longest-running satellite imagery program, with over 30 years of observations at a 30-m spatial resolution. Landsat satellites return to observe the same places on Earth every 16 days, though, leaving only 22 observations at most per year for most regions. If imagery is contaminated by clouds, cloud shadows, and/or snow, available observations are even fewer.
To overcome this data sparsity challenge, we designed our Bayesian LSP model to borrow information from other years to complement available data for any particular year. Thus, it is able to estimate annual LSP records directly from the sparse Landsat time series. Importantly, we also quantified pixel-wise uncertainty for each LSP record; uncertainty can vary with the density and quality of input time series but is rarely quantified by existing methods. We found strong agreement between our estimated LSP and the ground observations from two long-term research forests in the US, Harvard Forest in Massachusetts and Hubbard Brook Experimental Forest in New Hampshire, suggesting great potential for our Bayesian LSP model.
We believe that our Bayesian LSP model is an important step forward in producing long-term, annual, medium spatial resolution LSP data, and we hope it can open new opportunities for various research fields, including agriculture, forestry, ecology and climate change. Therefore, we provide open access to the model scripts for anyone to easily apply the model to their own interests!


