A New Way to Help Stop Insect Pests in Their Tracks

Spotted lanternfly, emerald ash borer, hemlock woolly adelgid, Asian longhorned beetle. These are but a few of the hundreds of exotic insect pests that have been accidentally introduced to North America, causing millions of dollars in damage, not to mention ecological havoc, across agricultural fields and forests.
Management agencies like the US Department of Agriculture work to contain these pests, searching for ways to curb outbreaks and control their impact. But how quickly is a pest likely to spread to a new area? And where?
Researchers at the Center for Geospatial Analytics at North Carolina State University recently developed a new forecasting technology that can help the USDA and other agencies answer these questions, more quickly and easily than ever before.
It’s called PoPS, the Pest or Pathogen Spread forecast, a sophisticated yet user-friendly tool that can be used to predict the spread of potentially any species.
Predicting the spread of pests with big data and models
Computer models are the go-to method for predicting the spread of insect pests and the pathogens that cause plant disease. Running these models typically requires a lot of data––gigabytes and gigabytes of data––and being fluent in the language of computer code. Assorted software is also usually needed, and so is a familiarity with the ins and outs of model calibration and validation: that is, making sure that a model is well-matched to the data feeding it and checking that the model is doing a good job of predicting what it’s supposed to.
For managers who need answers quickly, without being expert coders, the task can be daunting. Under most circumstances, preparing the data and models to simulate a pest’s spread can take months to a year. Enter PoPS, a nearly fully automated framework that asks its users for a few simple inputs to output spread predictions and comparisons of management scenarios.
What makes the new PoPS model different?
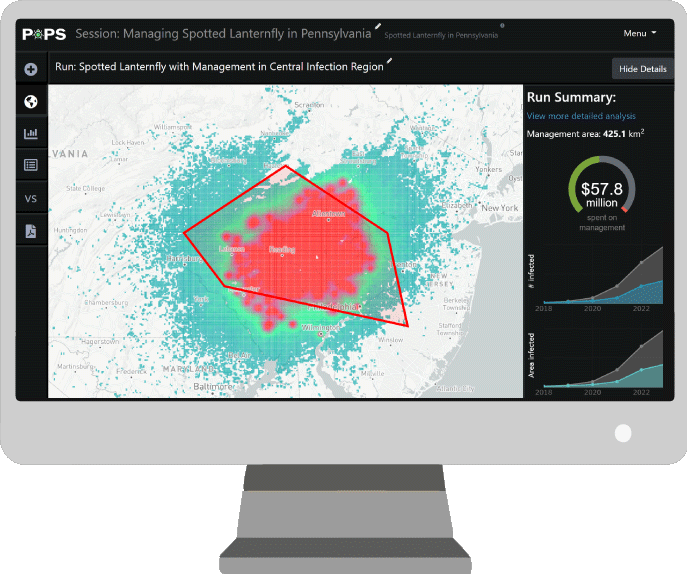
With PoPS, managers simply provide three years’ worth of infestation information and adjust a few values on the web-based dashboard to answer pressing questions about when, where and how much a pest problem is likely to grow, and how much it may cost to stop it.

“You can plug in your data and PoPS will do everything, and the validation will tell you how accurate it is,” says Chris Jones, a research associate at the Center for Geospatial Analytics and lead developer of PoPS. The framework uses two years of the input data to calibrate its mathematical model, and the third year of data to validate it. Weather data and maps of host plants are pulled from existing repositories, and PoPS even reclassifies raw values to ones the model can use. “Most models don’t help you do this,” Jones points out.
By using a computer mouse to draw shapes on a map of predicted spread, a user can even tell PoPS where they would like to apply management––such as eliminating host plants or setting targeted insect traps––and the system will calculate the financial cost as well as the impact on spread, to help compare treatment scenarios. Essentially, the system helps a user assess which locations are best to treat and the expected return on investment.
Harnessing big data and PoPS to contain the spotted lanternfly
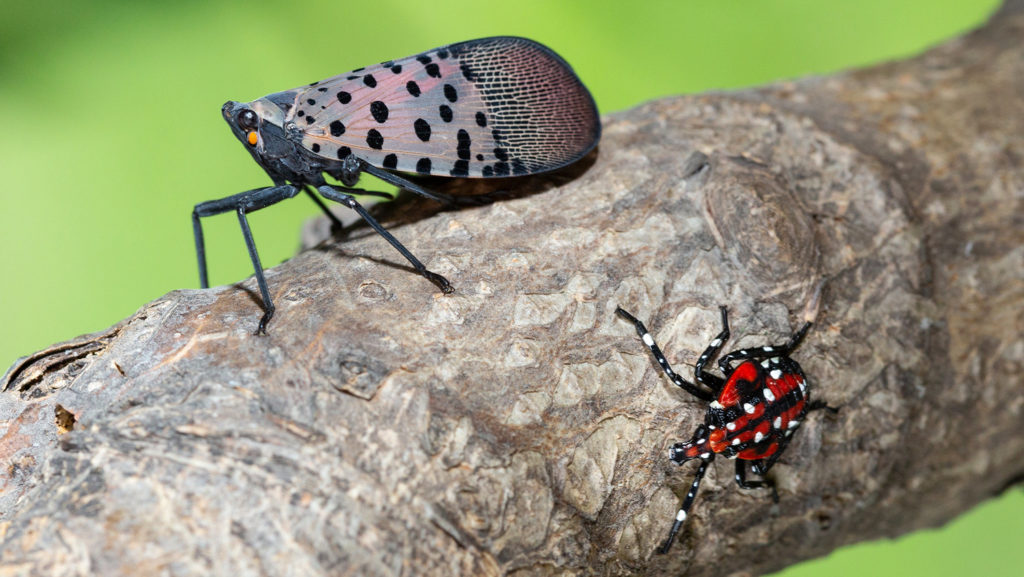
One of PoPS’ first tests has been predicting the spread of spotted lanternfly for the USDA and Pennsylvania Department of Agriculture. Native to Asia, the species was first discovered in southeast Pennsylvania in 2014; it has since spread to four other states, motivating the quarantine of sixteen counties.
Spotted lanternflies suck the life out of plants by drinking the fluids flowing through the stems. Their favorite food plants are also highly prized by people––including grapevines, hops and hardwood trees used for timber––threatening billion-dollar industries in multiple states.

The USDA Animal and Plant Health Inspection Service (APHIS) and Pennsylvania Department of Agriculture are aggressively targeting this emerging pest and outlined a budget for curbing its spread, but they also needed a geospatial tool to help them decide where to focus their efforts and to determine how much money would be needed to make an impact.
Jones and his team took on the problem, using PoPS to generate what-if scenarios of management within and outside of the quarantine zone, and with different levels of funding. In preliminary runs with PoPS, “spending an extra 16% on management led to a greater than 50% reduction in the total infested area, even when management was randomly distributed within the management zone,” Jones reports. A scenario with no management saw spotted lanternfly explode across the map, but strategic investment of limited management dollars saw the pest restricted to the containment area.
What’s next?
An initial partnership between NC State’s Center for Geospatial Analytics and USDA APHIS to build a model prototype “has blossomed,” Jones says, into a multi-dimensional project aimed at generating urgently needed decision analytics.
Currently a whole team of Geospatial Analytics doctoral students, postdoctoral scholars and research associates are hard at work optimizing the PoPS web interface, improving host maps and how the model functions and evaluating its many potential uses.
In April 2019, the research team hosted the APHIS Plant Protection and Quarantine deputy director on NC State’s Centennial Campus to unveil the PoPS dashboard, and in June the group took PoPS to APHIS headquarters, outside of Washington, D.C., to demonstrate its capabilities to more agency leaders.
From the beginning, the project has been a collaborative one. “This is a participatory process,” Jones says. Feedback from government scientists, analysts and on-the-ground managers has been integral to the design of the framework, and continues to inspire even more directions the research can take. “This project has grown immensely since we started two years ago,” Jones says. “APHIS is definitely planning for this to be a key decision tool for them.”
A new web interface will soon debut on the PoPS website, making the framework accessible to a wider audience of users. Project partners hope that it will drive progress in a range of applications. “This is not just for management,” Jones says. “Ideally I would like other researchers to use it too.”
For example, predictions from PoPS could be used to plan experiments and field sampling designs. Extension agents too could use the model to help farmers understand and predict the spread of insect pests and plant diseases across agricultural fields on time scales of weeks to months or years.
All of these uses have real-world implications, and harness data and computing for making on-the-ground decisions. Says Jones, “This is the direction I want all of my research to go––something people will use.”


