Service Learning in Action
The Center for Geospatial Analytics is celebrating the Spring 2017 graduation of 22 professional master’s students in Geospatial Information Science and Technology (MGIST)! During their final semester, each student in the MGIST program completes a service-learning capstone project, working directly with a community or industry partner to apply their knowledge and skills to a real-world problem. Service learning differs from community service, explains Charlynne Smith, instructor of the capstone course, in that students work collaboratively with their external partner to solve a problem together. In the process, everyone learns.
This semester, capstone topics ranged from tracking African vultures and controlling mosquitoes to discovering food history, serving low-mobility residents and community gardeners, retracing shifting shorelines and more. Read on for a glimpse into the exciting work of our professional master’s students!
Tracking the travels of African vultures

In eastern Africa, researchers are striving to protect the critically endangered white-backed vulture (Gyps africanus), a scavenger species crucial to the health of local ecosystems but suffering widespread and often inadvertent poisoning. To better understand the vultures’ habits and habitats, staff from the North Carolina Zoo and the Wildlife Conservation Society have attached GPS tags to ten birds in Tanzania to track their daily movements. MGIST students Jessica Allen and Nathanial Simmons partnered with Corinne Kendall, assistant curator of conservation and research at NC Zoo, to develop geospatial tools that can filter the thousands of GPS points collected and help Dr. Kendall’s team identify specific locations where the vultures feed and nest.
The filtered tracking data will provide timely guidance for field workers who strive to quickly determine whether wildlife eaten by vultures were first poached by humans or suffered from disease. The GPS data also reveal new and exciting information about vultures’ use of space: A story map created by Jessica recounts the tale of one extraordinary vulture called “Rosie,” named after the traveling heroine portrayed by Katherine Hepburn in John Huston’s 1951 film The African Queen. Rosie the (as it turns out, male) vulture flew over 1,700 miles in less than six months, traveling through seven countries from southern Tanzania to northern South Africa and hopping between national parks along the way. According to Dr. Kendall, this remarkable dispersal distance was previously unknown among vultures. Data provided by Rosie and others will help researchers better understand how vulture populations are connected, hopefully aiding their conservation.
Monitoring the risk of mosquito-borne disease
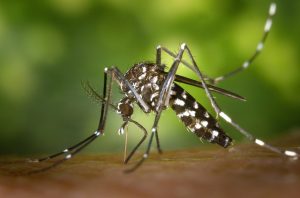
Mosquitoes and the diseases they spread pose significant risks to human health, yet quick and effective mosquito control remains an ongoing challenge. How can communities reduce their vulnerability to mosquito-borne illness and help health agencies know where treatment is needed most? The answer may very well lie in crowdsourced maps.
Three MGIST students partnered with the US Environmental Protection Agency this semester to help citizen scientists report mosquito sightings in their neighborhoods and contribute data to risk maps that can guide management efforts to reduce the spread of disease. Kacey Cummings focused on the town of Brownsville, TX, which was declared a Zika “cautionary area of concern” by the Centers for Disease Control and Prevention last December. Her bilingual online reporting survey allows citizen scientists to identify Aedes mosquitoes at different stages of their life cycle (i.e., egg, larva, or adult) and document where and when they were observed. Managers can then see the data displayed in real time in a web mapping application, which contains customized analysis tools to help decide when, where, and how to apply mosquito-specific pesticide treatments. Managers can also use the mapping application to keep track of where treatment has been done, and where more resources are needed. Claire Huang and Yang Lei produced online surveys and web mapping applications for Puerto Rico and Raleigh, NC, respectively. In action, these tools could help public health officials target mosquito control in response to real-time reports of mosquito activity.
Tracing oyster origins with historical Manhattan menus

Much of the food eaten by modern-day urban Americans is not produced locally, but instead must be shipped over long distances to our grocery stores and restaurants. Food historians are piecing together the story of when and why many of us stopped eating locally, and MGIST student Chelsea Piccone partnered with the National Humanities Center and professor Matthew Booker in NC State’s Department of History to help answer a key question related to Americans’ historical dining habits: In the 19th and 20th centuries, where did Manhattan restaurants get their oysters?
Chelsea scoured a database hosted by the New York Public Library called “What’s on the menu?” and examined records dating between 1850 and 1960. The database contains tens of thousands of menus listing hundreds of thousands of dishes. She narrowed the data down to thousands of records fitting her time frame with a focus on oyster dishes, then added addresses and zip codes to display the data spatially in a web mapping application. Her efforts show that during that hundred-year span, oysters served in Manhattan restaurants originated as close by as New York and New Jersey, and as far away as North Carolina, with even some oysters harvested in Rhode Island and Massachusetts. Future work will allow exploring how the origins changed over time, revealing ways in which supply and demand may have shaped the patterns in oyster consumption.
Helping newly arrived immigrants find the best ways around town

For people newly arrived in the United States, one of the greatest challenges to independence can be reliance on a vehicle. Safe walking and biking routes, on the other hand, can liberate refugees, immigrants, and other low-income groups to access services, employment, and educational opportunities. MGIST students Nate Armstrong and Meredith DiMattina partnered with the Raleigh field office of the US Committee for Refugees and Immigrants (USCRI) to develop web mapping applications that display a safe transportation network of sidewalks, greenways and low-speed roads in the city. “We want people to live not just in Raleigh but to be part of Raleigh,” says Scott Phillips, Director of USCRI in North Carolina. The students’ maps will help clients find the best routes among services.
Meredith also created a story map that explains the challenges faced by low-mobility populations in Raleigh, illustrating how quality of life can differ within and outside of areas less than one mile from a bus stop. “Rent is 30.2% higher inside of the transportation service areas than outside, while median household income is 10% lower,” Meredith says. Residents inside the service areas are less burdened by commute times and connectivity problems, she explains, but rather “really burdened by the costs associated with living in the accessible area.” This information can be used to guide decision-makers in Raleigh who assist with vehicle sponsorship.
Discovering soil quality in community gardens
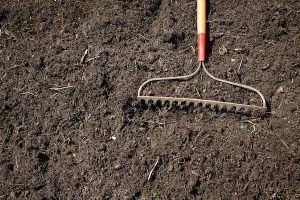
When community gardens are installed in urban areas, it’s important to consider how the soils in those gardens may have been impacted by pollution, to reduce exposure to potential chemical contaminants. MGIST students Keith Lindabury and Steven Henning partnered with staff at the Duke University Superfund Research Center to help gardeners with NC Community Garden Partners make informed decisions about where they plant.
Keith and Steven created web mapping applications that can display the locations of the state’s more than 240 community gardens relative to potential contaminant sources and levels of lead from historical vehicle exhaust, lead paint, factories, and landfills. “Analysis tools can be used to help determine if soil sampling may be necessary,” Keith explains, pointing out that soil in a garden may not be contaminated just because it is near a contaminated site. Users of Steven’s web map can also view land cover information from 1996 to see how land uses have changed over time. It could be very helpful to know, for example, if forested areas we see today were once the sites of landfills. “These applications provide the users with the ability to locate more suitable areas for new community gardens and determine if current gardens are in or near” contaminated sites or contaminant sources, Steven explains. Empowered with this information, gardeners can make more informed decisions when siting their community gardens or considering whether, and for what chemicals, to test soil in an existing garden.
Exploring changes in the dunes and shoreline at Jockey’s Ridge State Park
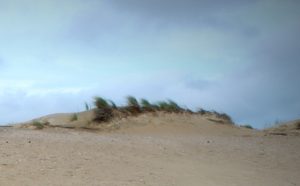
Jockey’s Ridge State Park in Nag’s Head, NC, is well known for its extensive dunes and dynamic shoreline. Since the park’s establishment in 1975, managers have been facing shoreline erosion, and they remain interested in predicting how park trails might be affected through time. According to MGIST student Kirk McElveen, “to figure out where the shoreline will be in the future, you have to know where it was in the past.” Kirk collected a variety of historical maps dating back to the 1800s to determine how the park has changed. Since 1949, he concludes, the shoreline has gained nearly 6 meters of land, eroding and building in different spots. Using this detailed analysis, he identified specific areas for recommended shoreline protection, to preserve trails that wend along the water. Complementing this work, MGIST student Russell Remy produced a data management tool that will allow park staff visualize changes in the inland dunes across Jockey’s Ridge.
And more!
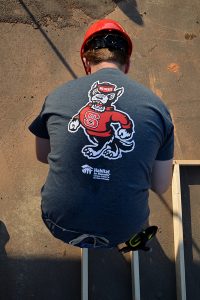
Kyle Blessman and Joe Parry partnered with the North Carolina National Guard to create digital document libraries that use an Enterprise geodatabase to tie spatial information to thousands of important documents for over one hundred locations across the state. Tim Blanchard and Kimberly Jacobus worked with Habitat for Humanity of Wake County to assess needs for affordable housing in the county and to identify the spatial distribution of applicants across governmental jurisdictions; this information will help the Wake Habitat’s advocacy committee.
Some students even produced projects for the companies or agencies where they currently work. Nicole Borgstrom is an intern at ProStar GeoCorp and compared approaches to web mapping using ArcGIS software versus Prostar’s Transparent Earth. Rebecca Bayham is an environmental scientist at Eastern Research Group, and partnered with her coworkers and a client at the US EPA to create a web mapping application and analysis tools that will streamline identifying emissions sources, such as ponds at wastewater treatment plants. Michelle Flemming is an employee of the City of Charlotte Planning Department and devised a strategy to efficiently automate handling applications for new subdivisions and rezoning requests. Catherine Heindel created a new database and web mapping application to help manage fiber optic networks for her employer, WideOpen Networks, headquartered in Blacksburg, VA.
Congratulations to all of our graduating MGIST students on their success!