Helping Community Partners with GIS Solutions

The Center for Geospatial Analytics is celebrating the Spring 2018 graduation of thirteen professional master’s students in Geospatial Information Science and Technology (MGIST)! During their final semester, each student in the MGIST program completes a service-learning capstone project, working directly with a community or industry partner to apply their knowledge and skills to a real-world problem. Service learning differs from community service, explains Charlynne Smith, instructor of the capstone course, in that students work collaboratively with their external partner to solve a problem together. In the process, everyone learns.
This semester, capstone topics ranged from illustrating the history of Shenandoah National Park to tracing the origins and recent outbreaks of the disease responsible for the Irish Potato Famine, predicting landslides, exploring park accessibility, serving the NC National Guard and more. Read on for a glimpse into the exciting work of our professional master’s students!
Illustrating a rich history in Shenandoah National Park
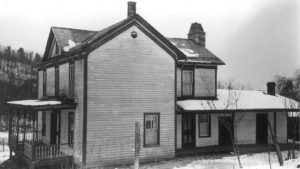
The “Exploring Park History” web mapping application for Shenandoah National Park launched in June 2016, and has been a big hit with an interested public, as it allows viewers to discover land parcels occupied before the park was established and learn about the families who lived there. When the app was launched, Bill Slocumb, research associate at the Center for Geospatial Analytics and a partner on the National Park Service project that developed it, predicted that the application would continue to grow. He was right. This past semester, MGIST student Shane Gainan worked with Bill and the National Park Service to develop a method for quickly and easily adding historical photographs and other digital documents to the parcel records. “Bottom line, the database outgrew itself,” Shane says, “and they wanted to share more with folks, the public, and be able to add data more easily and then query that data more easily. And that was the primary goal of my project—to facilitate that.” Shane’s work will reduce person-hours at the National Park Service for attaching digital files to records in the database, and public audiences will benefit from a deeper glimpse into history.
Tracing plant disease origins with historical documents

In the mid-1800s, a plant disease called “late blight” erupted in Europe, causing the infamous Irish Potato Famine. Several years before the famine, the same disease struck farms in the United States, and the geographic origin of the outbreak remains a mystery. MGIST student Yi-Peng Yang worked with Laura Tateosian, faculty fellow at the Center for Geospatial Analytics, to better understand the spread of the disease using nineteenth-century documents. She modified text mining tools to scour over 6,000 pages of scanned agricultural reports from 1841 to 1850 to find place names, then created interactive maps of spatial data using open source platforms to visualize the locations of outbreaks across time.
Tracking recent outbreaks of the disease behind the Irish Potato Famine

The “late blight” disease that caused the Irish Potato Famine of the 1840s and 1850s is still a serious disease today, affecting both tomato and potato crops across the United States. MGIST student Chris Parker partnered with USAblight, a national organization tracking outbreaks since 2011, to map high-risk areas and outbreaks over time. “Two of my major research interests in geospatial analytics are how GIS can be used to manage disease and how GIS web applications can be used to communicate outbreak data to the public,” Chris says. “Luckily the MGIST program has a community partner with similar interests.” Chris combined interactive maps, text and photos to develop a data-rich story map conveying the latest information on late blight in the US. “Disease mapping is good for pinpointing high-risk areas for late blight, and analyzing change in the disease over time can help to potentially highlight [spread] patterns associated with the disease,” Chris says. The maps he created parse out disease data by year, state and county, strain genotype, host type (potato vs. tomato) and conventional vs. organic agricultural practices.
Predicting landslides in southeast Alaska
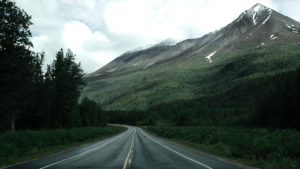
Steep terrain and heavy precipitation make landslides a threat to life and property in southeast Alaska. The National Weather Service Forecast Office in Juneau has created a database containing locations of past landslides and associated weather conditions, and now MGIST student Carrie Suffern has used these data to create web mapping applications that will help predict future landslide events. “I’m really excited about this project,” Carrie says, “as it enabled me to use some of the GIS skills that I learned in the program as well as my expertise in meteorology from working as a forecaster for the National Weather Service in the Juneau office. I’m thrilled to be working with the Juneau office and partnering with them.” For her capstone project, she “decided to create four visualization tools ranging from more general public view all the way down to individual forecaster use,” Carrie says. One of the tools she created is a web mapping application that constantly updates with current precipitation amounts for the past six hours. If displayed at the Juneau Weather Service office on their “situational awareness wall,” her map “would hopefully be blank most of the time” and then plot areas where weather conditions matched those that triggered past landslides. She also created a story map containing information about landslides in the area.
Revealing ease of access to local parks

The North Carolina State Parks Grants Program has funded park improvement and recreation projects across the state, with specific projects aimed at increasing accessibility to individuals with disabilities, low-income families and veterans. Where are these park projects located, and how accessible are they to these groups? MGIST students Steven Ellis and Jeff Adamchak both worked with the NC Division of Parks and Recreation to map funded projects and conduct walkability analyses. Steven focused on veteran populations served by the parks and used information from past studies on exercise to determine 10-minute walkability for “older,” “younger,” and “brisk” walkers, mapping the distances around parks accommodating these groups. He also used census data to view veteran population data within those distance buffers. “Veterans are a stated target demographic for park grant monies,” Steven says. “I’m a veteran myself, and that’s why I ended up choosing a veterans analysis.” He continues, “This web app can be used to show the public how their money’s being spent, but I also see a lot of value for using it in the vetting process for future grant applicants.” Jeff also created a publicly viewable web mapping application to show the location of parks, with grant details associated with each location, and determined the populations of veterans, families and families below the poverty line that are within a half-mile walking distance to each park. Future grant applicants and application reviewers could use these maps to find geographic gaps where target populations could be better served.
Easing a paperwork burden at the NC National Guard
When military units in North Carolina move munitions from one site to another, the transfer goes through a rigorous approval process, with signatures gathered up the chain of command—generating a lot of paperwork. MGIST student and active military officer Craig Tryzbiak developed a method for the NC National Guard to track the movements of arms, ammunition and explosives across the state using a digital request form and a web mapping application that would save time and paper. “This is more of a proof of concept because it won’t exist in the same environment,” Craig says, explaining that the National Guard would use their own secure system to recreate the tool. However, Craig demonstrated how a web mapping application could be used to determine the quickest route between sites and how the National Guard could “display that within their common operating picture in the Joint Operations Center and allow users to print their route, as a route layer, and get turn-by-turn directions.”
And more!

Meredith Stull partnered with Growers, a precision agriculture company, to develop a data collection app and web mapping application that employees can use to collect soil data at farms and navigate between agricultural fields. Paul Schrum created a database “bridge” using Python coding to help the US Army Corps of Engineers Field Research Facility in Duck, NC, transfer information from an old database to a spatial one that can be used to map data from land and ocean sensor gages. Michelle Lopez partnered with the Southeast Climate Adaptation Science Center to map climate resources for federally and state recognized tribal nations in the southeast region. Will Jonas built a geospatial database and web mapping application for High Rock Lake on behalf of Yadkin Riverkeeper, to compile over ten years’ worth of monitoring station and sample site data from agencies interested in the lake’s water quality. “It’s the first composite dataset for High Rock Lake with spatial parameters that we’re aware of,” Will says. “And this becomes an extremely valuable tool to create relationships and models between different types of data.”
Both Dave Mathern and Letitia Branch-King worked with the Hinton Rural Life Center in Hayesville, NC, which serves two rural counties in western North Carolina and one in Georgia; each student developed an independent approach to mapping resources such as childcare, medical care, and housing services in the region. “The goal of the project was to compile community asset data into one source and then create a [web mapping] application for residents to easily search for specific services,” Dave says.
Additional MGIST students engaged with experts from the Center of Geospatial Analytics to develop their capstone projects. Michael Tutwiler worked with Faculty Fellow Perver Baran to enhance functional capabilities in the revolutionary online Invision Raleigh system for visualizing urban planning alternatives. Geeta Nakkina partnered with Faculty Fellow Bethany Cutts (Department of Parks, Recreation and Tourism Management) to analyze exposure to environmental hazards and social vulnerability among communities in Robeson County after Hurricane Matthew. Based on her analysis, Geeta says, “populations confronting higher concentrations of flood related environmental hazards also tend to be the very populations that are most sensitive and vulnerable to health challenges.” The story map she created details the aftermath of the hurricane and features interactive maps of her findings.
Congratulations to all of our graduating MGIST students on their success!