Exploring Urban Flooding with Satellite Imagery at AGU
Editor’s note: Each semester, students in the Geospatial Analytics Ph.D. program can apply for a Geospatial Analytics Travel Award that supports research travel or presentations at conferences. The following is a guest post by travel award winner Rebecca Composto as part of the Student Travel series.
The American Geophysical Union (AGU) Fall Meeting is an incredible opportunity to learn and meet new people. In December of 2023, and with the help of the Travel Award from the Center for Geospatial Analytics, I presented my research for the first time in person at AGU’s Fall Meeting. This year’s meeting had over 22,000 people in attendance and was an awesome (and overwhelming) opportunity to hear talks from all different subject matter experts and connect with people from around the globe.
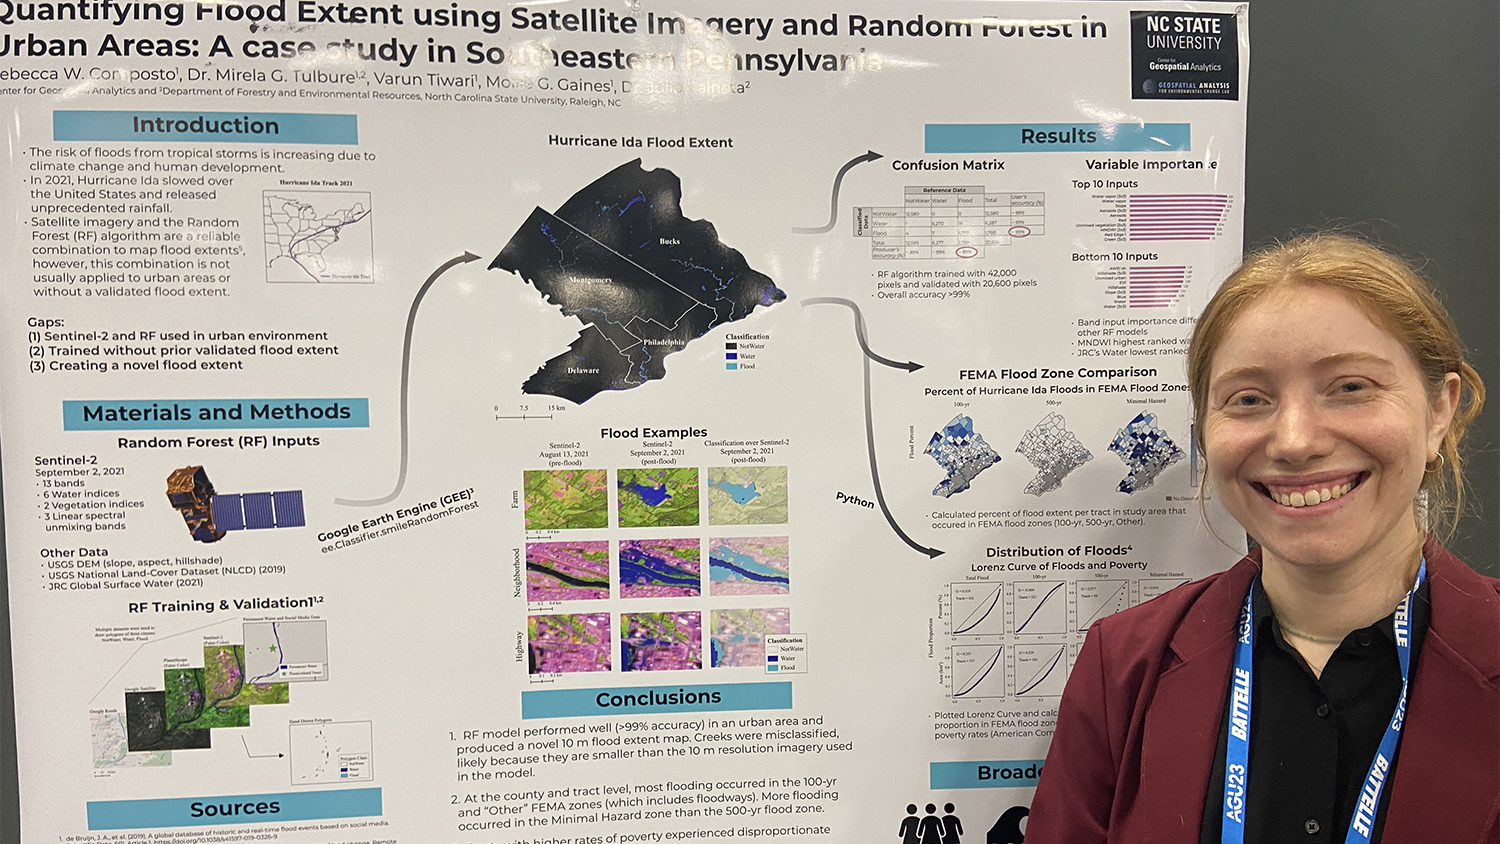
My research focuses on using satellite imagery and machine learning to map urban floods. In particular, I am studying the flood extent after Hurricane Ida in southeastern Pennsylvania using Sentinel-2 imagery and a Random Forest model. No flood map exists for this event and study area, and I am excited to have created one and compared it to the Federal Emergency Management Agency’s (FEMA’s) floodplain maps. What I found, which agrees with previous Center research on flood damages occurring outside of high-risk zones, is that more flooding after Hurricane Ida occurred in the FEMA-designated “Minimal Hazard” zone than the (presumably more risky) 500-year zone, which has a 0.2% chance of flooding every year.
When I presented a poster on my research, I gained valuable feedback from people in academia, government and industry. From FEMA contacts, I learned the value of not just a flood extent map, but a map that includes flood depth and the first floor height of buildings. From academic and industry visitors who study flood modeling, I learned the usefulness of a known flood extent for calibrating and testing flood maps. After four hours of conversations, I gained invaluable connections and feedback on a project that I will continue to work on throughout my Ph.D. research.
During AGU I had the invaluable experience of seeing my advisor, Dr. Mirela Tulbure, give an invited presentation. She brought the audience in by putting them in the shoes of someone whose home is repeatedly flooded. I also saw other engaging speakers who talked about the different machine learning algorithms and how they can be applied to satellite imagery. I saw talks related to surface water and floods and learned about a few new satellites to check out. There were also talks on hydrological models, something outside of my wheelhouse, that pushed me to think more about my research in a broader context. I also attended talks about education and learned about a treasure trove of lesson plans related to satellite imagery that can be adapted for any age group. I walked away from AGU with so many new topics to read about, I will hopefully catch up before next year’s meeting.
When I was not in the conference center darting between rooms for presentations, I was attending other events put on by AGU and partners. I attended an open house by Planet Labs, a company that sells high-resolution satellite imagery, which I have used in my research. I got to see their satellites in person and learn about their latest products. I also enjoyed walking around San Francisco with Center colleagues and eating dim sum. During lunchtime the weather was warm enough to eat outside and enjoy the sun before an afternoon of indoor talks. I am so grateful for the opportunity to go to San Francisco, explore and gain the invaluable experience of attending AGU in person.
Acknowledgements: Thank you to Dr. Mirela G. Tulbure, Dr. Julio Caineta, Varun Tiwari and Mollie D. Gaines for the work on this project. Thank you also to the Graduate Student Association and the GSA Travel Assistance Award for additional funding to present at AGU.
Photo Gallery
Click a thumbnail image below to expand:
- Categories:
