Components to Consider in Choosing Plant Disease Forecast Models, a Presentation at IALE
Editor’s note: Each semester, students in the Geospatial Analytics Ph.D. program can apply for a Geospatial Analytics Travel Award that supports research travel or presentations at conferences. The following is a guest post by travel award winner John Polo as part of the Student Travel series.
The International Association of Landscape Ecologists (IALE) had its North American chapter meeting for 2024 in Oklahoma City, OK this past April. This meeting is not as big as that of the Ecological Society of America (ESA) or American Geophysical Union (AGU), but it is packed with people who work on topics I’m interested in: habitat conservation, land cover change, and remote sensing applications to land cover research, among others. I submitted a presentation abstract to the meeting and it was accepted, so I had an active part in the meeting. I had not given a presentation in a long time and thus was nervous about doing so, but knew I had to shake off the rust.
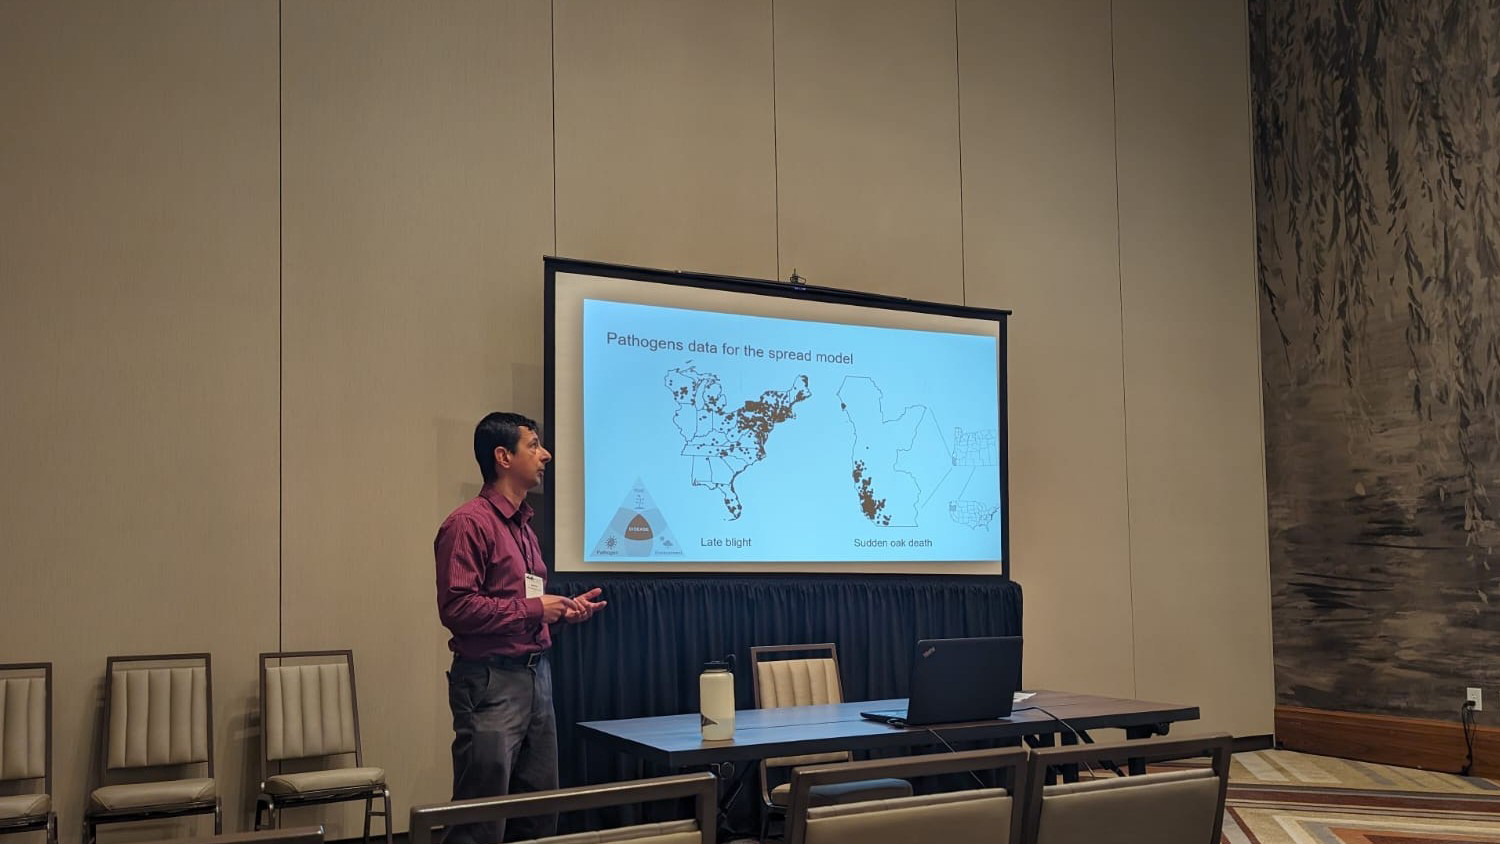
My presentation was based on the first chapter of my dissertation, in which I am modeling the spread of two plant diseases, using information from two different data collection methods and two different forecast models. One of the diseases is late blight, a crop disease, and the other, sudden oak death, is a tree disease. The two models I used were one I call the degree severity value (DSV) model, which assigns a risk score to a location based on relevant weather factors, and the Pest or Pathogen Spread model, PoPS, which predicts disease spread in time and space by using not just weather, but data about the disease’s biology, like spread rate, and data about host presence. The late blight data were opportunistically collected, meaning that the disease was recorded wherever and whenever observers happened to spot it, while the sudden oak death data were collected via a systematic monitoring effort. Opportunistic data collection is easier, but may not completely reflect the presence of the disease, whereas systematic data collection can generally provide a more complete picture, but is more difficult.
Just as the two data collection methods have tradeoffs (ease vs. completeness), forecast models can vary in their usefulness, when stakeholders rely on such systems to help decide on treatment measures. The PoPS model’s forecast for sudden oak death validated well against actual data, making it useful for managing outbreaks in thousands of hectares that are difficult to monitor. For sudden oak death, the DSV forecast was less useful, since it lacked the specificity a forest manager relies on. The DSV, being more general, is useful for a farmer who worries about a crop disease like late blight and who will know the location of their field(s) in relation to forecasted areas of infection. Creating a forecast for late blight with PoPS is still in progress, since the sparse nature of those data has been difficult for the model to analyze.
Besides delivering my talk, which was the focus of attending for me, I met researchers from multiple federal agencies. I’m interested in working for a federal agency once I’ve graduated. Our first day of the meeting, at a scheduled lunch with mentors, I got to meet a researcher from the US Geological Survey. I asked her several questions about how she uses geospatial analysis in her work, including what resources are available to her and what challenges she faces. I also talked to people from different sections of the US Department of Agriculture who work in land cover to learn what they see as the upcoming big themes related to their work.
Acknowledgments: The Biological Invasions lab for feedback on the early draft of my talk and the Center for Geospatial Analytics for research support and the Geospatial Analytics Travel Award.
- Categories: