Statpaders & Statisticians: My Experiences at a Sports Analytics Conference

Editor’s note: Each semester, students in the Geospatial Analytics Ph.D. program can apply for a Geospatial Analytics Travel Award that supports research travel or presentations at conferences. The following is a guest post by travel award winner Christopher Dunstan as part of the Student Travel series.
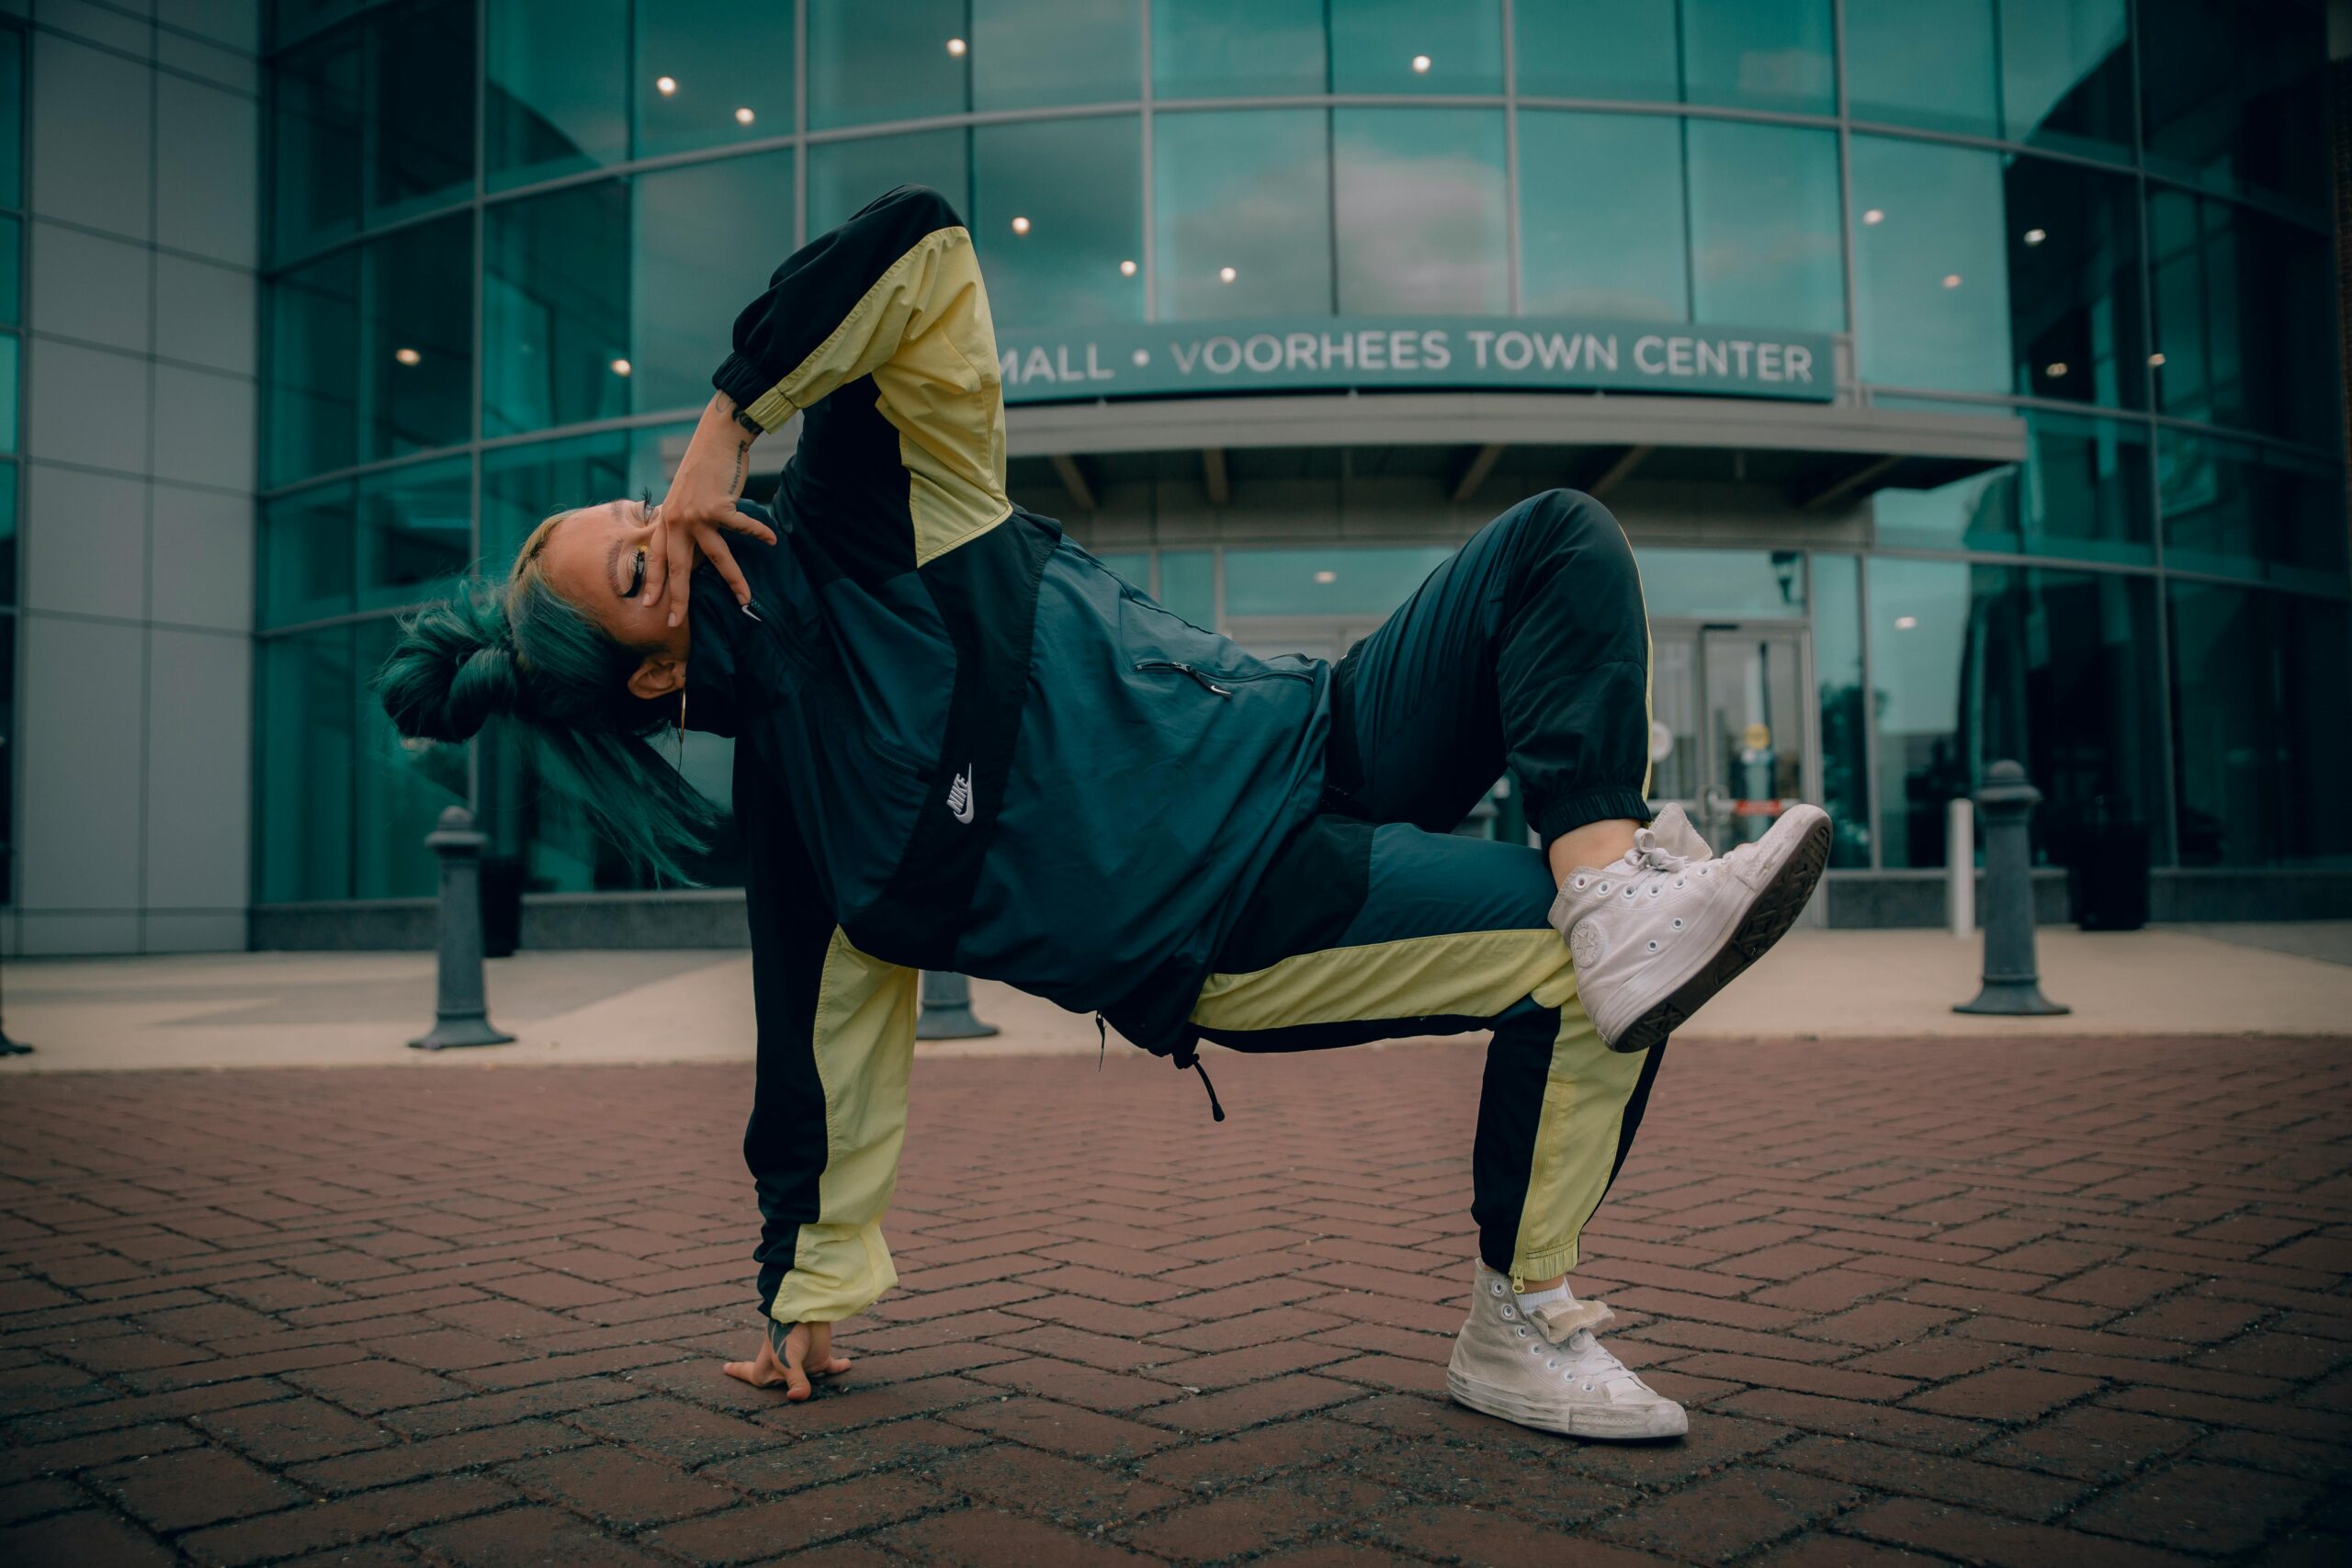
During the summer of 2024, I had the privilege of working with the U.S. Olympic and Paralympic Committee. My role focused on analyzing Olympic breakdancers to gather insights and evaluate various elements of their dance styles. Additionally, I studied the characteristics of individual breakdancing rounds to identify key factors contributing to a winning performance. The analysis revealed that the duration of a breakdancer’s round did not have a statistically significant impact on the likelihood of winning a round. However, both the first and final movements of a dancer’s routine were found to have a statistically significant influence on the outcome. My work was then accepted to Carnegie Mellon’s Sports Analytics Conference (CMSAC).
Sports analytics is a rapidly evolving field at the intersection of sports and data science. CMASC is one one of the premier conferences in the field. Attending CMSAC was an invaluable experience, providing me the opportunity to present my analysis of Olympic breakdancers while gaining deeper insights into the sports analytics field.
During my time at CMSAC, I was exposed to a wide variety of tools and projects within the field of sports analytics. Many of the presentations highlighted player tracking, using technology to monitor the movements of players during games and practices, as a groundbreaking innovation. One keynote speaker discussed Major League Baseball’s (MLB) advanced tracking system, which identifies the position of all players and the ball frame by frame. Their statistical analysis revealed that outfielders must begin moving before a batter hits the ball to position themselves for a successful catch.
Common sports analytics tools were also featured in several presentations. For example, RShiny, an R package for creating interactive dashboards, was frequently used to visualize project results. Web scrapers, which extract data from websites, are often employed to collect detailed statistics from sports analytics platforms. My prior research projects and coursework have provided me with hands-on experience using these tools, which gave me a strong foundation to appreciate the projects shared at CMSAC.
The conference offered valuable insights into the workflows and dynamics of the sports analytics field. Overall, CMSAC was an inspiring introduction to my future career in sports analytics.
- Categories:


