Meeting Real-World Needs with GIS Expertise
The Center for Geospatial Analytics is celebrating the May 2019 graduation of seventeen professional master’s students in Geospatial Information Science and Technology (MGIST)! During their final semester, each student in the MGIST program completes a service-learning capstone project, working directly with a community or industry partner to apply their knowledge and skills to a real-world problem. Service learning differs from community service in that students work collaboratively with their external partner to solve a problem together. In the process, everyone learns.
This semester, four capstone projects concerned hurricanes and flooding, and ranged from predicting pipe washouts to forecasting flood damage, visualizing storm surge and using artificial intelligence to assess buildings. Six projects focused on infrastructure, and concerned revitalizing city centers, managing utilities and understanding future power needs. And that’s not all! Read on for a glimpse into the exciting work of our professional master’s students.
Addressing the Dangers of Hurricanes and Flooding
Predicting drainage pipe washout
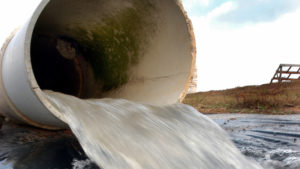
During extreme rainfall, communities rely on drainage pipes under highways to keep roads from becoming impassable. But these pipes can become overwhelmed when the volume of water they receive is more than they were built to handle. In these cases, the pipes become washed out, and roads are damaged. So it’s important to assess these pipes and try to figure out whether they will meet future stormwater challenges.
MGIST student Larry Sanders worked with the North Carolina Department of Transportation (NCDOT) on a pilot project to quantify the risk of drainage pipes becoming washed out during future rainfall and identify locations along highways where they likely will. The initial focus for this proof of concept was Robeson County, and Larry included in his analyses the known locations of drainage pipes that were washed out by Hurricane Florence in September 2018. Using a watershed analysis, he calculated the amounts of water received by pipes in the county, with the ultimate goal of identifying pipes at risk.
Forecasting damage to businesses in the floodplain
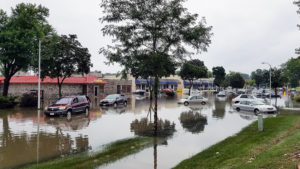
When rivers overflow their banks after extreme rainfall, they expand to fill historical floodplains––where many people have built homes and businesses. When flooding is severe, buildings that have been safe for many years may suddenly face extensive water damage. “Severe flooding has impacted North Carolina frequently in recent years, and businesses located in the floodplain are potentially at risk,” says MGIST student William Ross. “Quantifying that potential risk is a complex task,” he explains, and so he partnered with North Carolina Emergency Management to create a “user-friendly toolkit from which meaningful conclusions can be drawn.”
William built a web mapping application that could “establish the spatial relationships between the businesses in North Carolina and the floodplain extents for severe flooding events and to estimate the extent of damage to businesses that are at risk within the floodplain.” The app he created includes a heat map tool and can provide summary statistics by county and by business sector. “The ultimate vision for this toolkit is that it will be part of a decision-making process that will guide resource allocation decisions that enable businesses in North Carolina to better prepare for and endure severe flooding events,” William says. “Think of it as a piece of the risk management puzzle, providing a means of risk assessment that fits into the broader purpose of NCEM and the risk management program.”
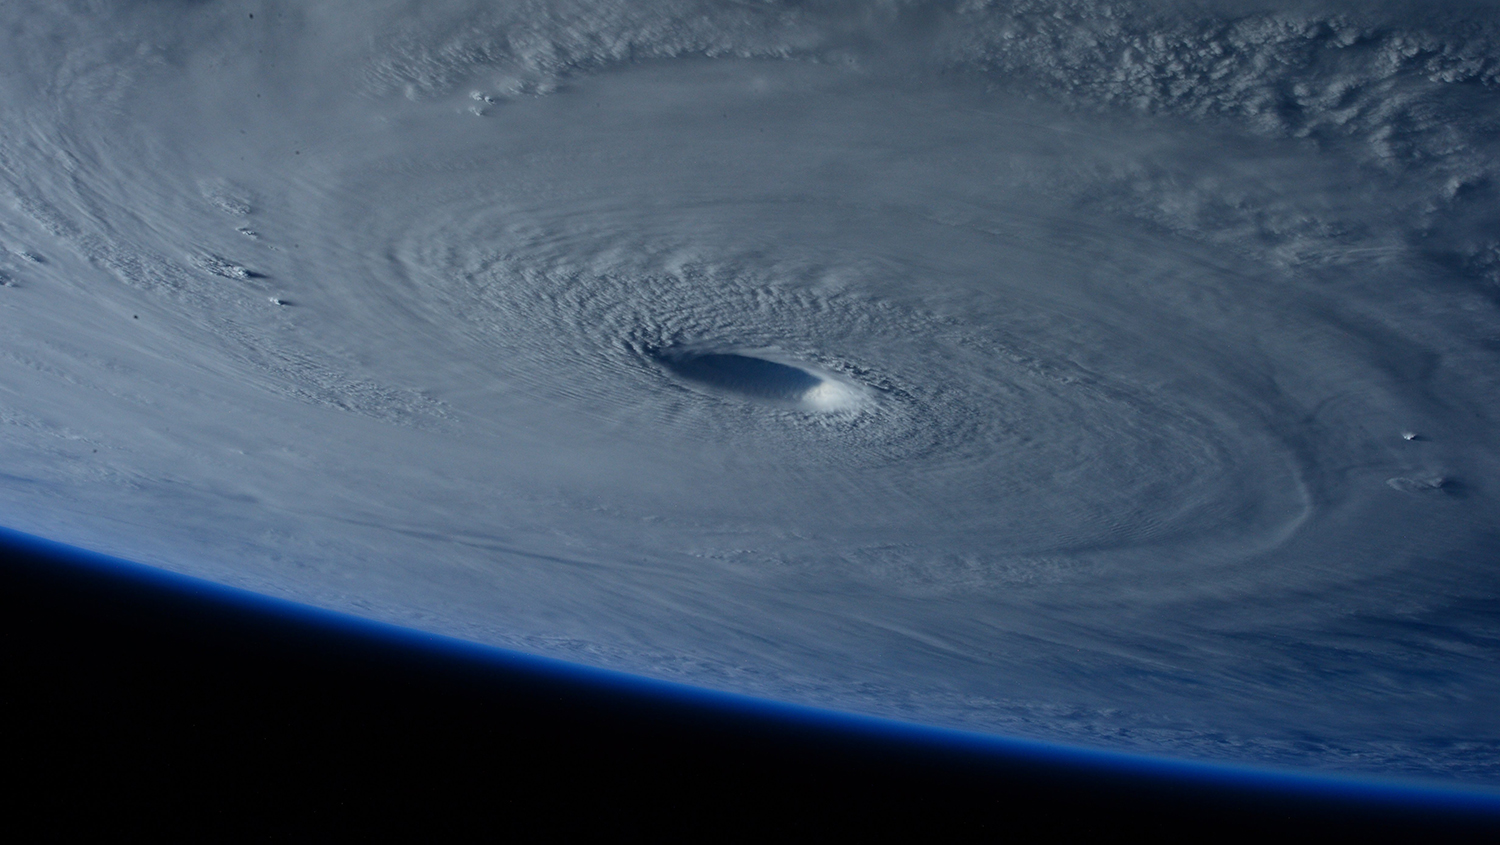
Visualizing storm surge

The flooding that accompanies hurricanes and other strong storms is not just a matter of rainfall. Intense winds can push the ocean’s surface towards shorelines and cause seawater to surge inland. But for most people, understanding this so-called “storm surge” is not intuitive. A forecasted storm surge of, say, four feet does not immediately translate into which properties will be in danger. “Communicating storm surge is one of the most difficult aspects of trying to get hurricane preparedness,” says MGIST student Brandon Black. “We’re trying to convey a message to people that (1) may not have ever seen storm surge in their life, (2) don’t understand what it actually is and (3) don’t understand how much it’s really going to impact them.”
And so Brandon partnered with National Weather Service personnel in Mobile, Alabama, to create “a web application that allows forecasters to develop inundation maps with a few simple clicks,” depicting forecasted storm surge and how far the flood waters will reach. The map allows forecasters to explore a variety of storm surge scenarios and zoom into local views of coastal counties in Alabama and Florida to identify individual buildings that may be at risk, particularly key infrastructure like schools, hospitals and police or fire stations. “I reached out to some of the local partners around our area, mainly emergency managers for our coastal counties at the National Weather Service in Mobile and tried to determine some of the key infrastructure that they need for their decision-making,” Brandon reports. The ultimate goal was “to provide forecasters and partners a better visualization [tool] for preparation and response to a hurricane’s landfall.”
Using AI to ID storm damage

In September 2017, two powerful storms struck Puerto Rico: Hurricane Irma and Hurricane Maria, a category four storm when it made landfall. The Federal Emergency Management Agency (FEMA) response included contracting with consulting firms to assess the damage. One of these firms was Atkins, where MGIST student Eric Coughlin has been a GIS Manager for almost fourteen years.
“Atkins was tasked by FEMA––as we have been in the past for these natural disasters––to perform what’s called substantial damage estimation [SDE],” Eric explains. “We send out teams in the field with tablets and a FEMA application…and they go around and they inspect or assess homes that have been damaged by natural disasters. Typically, this contract gets engaged when there’s a flood event, because SDE assessments are part of the National Flood Insurance Program…” In Puerto Rico after the 2017 hurricanes, Atkins’ team performed more than 11,000 post-storm damage assessments.
For his capstone project, Eric used a subset of these assessments and artificial intelligence to develop a database that details the construction material, number of stories and roof type of the buildings on the island. Specifically, he used a machine-learning algorithm that could interpret photos based on an initial training set of pictures that he labeled by hand. As Eric explains, the ultimate goal is to “provide decision-makers, local officials in Puerto Rico, with the enhanced and updated building stock information to improve situational awareness.” With a decision-tree model created by his coworker and capstone partner, Michael DePue, Eric will develop a web app that will help test the impacts of different wind speeds on building damage. “Local officials can use the results of the model output to make decisions about building code enhancements, storm preparation and flooding preparation,” he says.
Helping Organizations To Manage Their Infrastructure
Revitalizing areas of Clinton, SC, and São Paulo, Brazil

As cities grow and change, they sometimes need to reinvent neighborhoods or attract new kinds of industry. Two capstone projects this semester focused on helping cities near and far to navigate a new future.
MGIST student Mary Wasson, a full-time GIS Analyst for the City of Clinton, SC, created a new workflow for linking spatial information about the city’s infrastructure and the city’s work order system. The city hopes to “attract industry and show potential business partners that we have the infrastructure and technology to meet their needs,” Mary explains, and so part of that plan is “better asset management” with GIS. Essentially, the web mapping application that Mary developed will help the city better track all of its sewer lines, manholes, water lines, fire hydrants, power poles, optical fiber lines and other infrastructure so that future improvement projects can be efficiently managed. This work, she explains, will “prolong asset life” and lead to “better decision-making about asset rehabilitation, repair and replacement.”
In 2018, the University Global Partnership Network granted a Research Collaboration Fund award to the Center for Geospatial Analytics and University of São Paulo to begin a joint project called “Bringing environmental quality and new life to city centres.” For his capstone project, MGIST student Ryan Molumby collaborated with this partnership to help identify areas suitable for redevelopment in São Paulo, Brazil. Ryan performed analyses and created a web mapping application that takes into account variables such as noise, public lighting and proximity to subway stations, attractions and parks and cultural spaces. The analysis also examined walkability in the city and the arrangement of existing buildings.
Keeping tabs on public utilities

Power and water are two resources that we consistently expect to flow into our homes and businesses without interruption. Managing these resources, though, can be a complicated business, and demand for them varies across space and over time.
To help the Winston-Salem Forsyth County Utility Department track water consumption within their city and county boundaries, MGIST student Jennifer Fanzutti developed a web mapping application that permits exploring trends in water use. The joint city and county agency manages over 2,000 miles of water lines and over 130,000 residential and commercial accounts, and treats about 37 million gallons of water a day, Jennifer explains. Tracking consumption spatially will help them better understand where and when demand is highest (and lowest), and will help update the process they use to set rates. “I’m really pleased with the way this application turned out,” Jennifer says, “and I think it can add a lot of value to the utility department and show consumption on a variety of levels.”
To manage utilities, companies often use particular software, which may be improved by adding different functionalities or switching to new platforms. MGIST student Carson Coggins worked with the company Partner Software to recreate in an Esri environment their “Field Design” software application that is used to plan utility network infrastructure such as electricity distribution networks or water mains. Carson developed both a web mapping application and leveraged Collector for ArcGIS so that information about utility networks can be gathered in the field. Says Carson, “This project provides a real-world analysis of how companies in the utility industry can leverage the Enterprise solutions of Esri to mesh their current practices, standards and data into comprehensive spatial databases that serve utility network data to customized web mapping applications.”
Understanding future power needs

As populations grow and weather patterns shift under global climate change, energy needs in the US are likely to differ from what they are today. To help predict energy generation and use through 2050, the National Renewable Energy Laboratory operated by the US Department of Energy created the Regional Energy Deployment System, or ReEDS model. Partnering with Center for Geospatial Analytics research associate Okan Pala, MGIST student Lana Morris developed new ways to interact with the model to generate new knowledge about the future. Her work followed up on, and expanded, a capstone project by Jacob Mouw in Fall 2017. “The goal of this analysis is to build off of Jacob’s existing web application and develop geoprocessing tools that will allow researchers to further query and visualize the ReEDS Model,” Lana explains.
In particular, Lana’s work helps to better visualize “spatial relationships of where energy is consumed versus generated.” Using several different climate change scenarios, she was able to show how power sources, fuel types and demand are likely to change. “The application will be used to understand how the movement of energy, power generation technologies and transmission flows will change over time,” she says, “particularly within the Western states, because these are the regions that are going to be most affected by energy demand and drought in the future. And it’s important to understand how electricity will behave in the future so that we can prepare for a changing climate with limited resources.” A story map Lana created describes her project in detail.
And More!
Several MGIST capstones expanded on the work of students in previous semesters: Lyndsay Heeter continued the work of a December 2018 graduate to create a web mapping application for the nonprofit US Composting Council, featuring the locations of compost manufacturers and distributors nationwide. Winnie Baraza followed up on a project from last semester with CBRE | Raleigh to determine the best locations for new businesses. Marc Griffin built on capstone work by students in Spring 2017 and Fall 2018 with NC State’s Department of History professor Matthew Booker to reveal patterns of oyster harvest and consumption in Manhattan restaurants in the nineteenth and twentieth centuries. Marc’s story map, complete with historical photos and interactive tools, tells the story of spatial relationships between supply and demand.
Additional projects supported government and nonprofit groups to further their missions:

Anthony Myers worked with Cabarrus County, NC, to help county officials understand patterns in response time to fire calls. “When we talk about fire response, minutes and seconds can make all the difference in the world,” Anthony explains. “The county is growing, and that in turn has increased the amount of service calls.” Using ten years of dispatch data, Anthony created a web mapping application that helps visualize the locations of calls and fire stations, and changes in call frequency and response time over the years.
Kelsey Ayers partnered with Recreation Resources Service to create a multi-user database that the group’s employees across North Carolina can use to edit and share data in real time, as well as use in a web mapping application to examine population demographics around parks in the state.
Working with the nonprofit organization Clean Jordan Lake, Susan King performed analyses and created a web mapping application to help the group track the hundreds of cleanups its 6,800 volunteers have performed over the past decade along 20 miles of the lakeshore. To date, these volunteers have removed 15,500 bags of trash and over 4,500 tires.
In conjunction with the Recovery Alliance Initiative, Alexander Anderson developed a database and web mapping application to help people suffering from substance use disorders to find local treatment resources such as support groups, inpatient services and more. “The goal for this project,” Alexander explains, “was to fill that [information] gap via an interactive database and publicly available web mapping application, just to get that information out there to as many people as possible.” Says Alexander’s capstone partner at Recovery Alliance Initiative, Mariel Swiggard, “He’s built us something wonderful in and of itself, but he’s also built us a foundation where we have lots of possibilities moving forward.”
Congratulations to all of our graduating MGIST students on their success!