Visual Analysis of Ship Data Using Omnisci Immerse
Editor’s note: Each semester, students in the Geospatial Analytics Ph.D. program can apply for a Geospatial Analytics Travel Award that supports research travel or presentations at conferences. The following is a guest post by travel award winner Umesh Gupta as part of the Student Travel series.
Performing big data analytics is a challenging task for any domain today, and attempting to produce results in real-time or near real-time adds even more complexity. Irrespective of how advanced the sensor-receivers collecting data are, those data often are very noisy and demand heavy pre-processing before you can even start fitting them into your problem definition. Those challenges are not new, and there are existing commercial frameworks being offered to help, but connecting your data pipeline with any other third-party or open-source visualization tools or databases creates an additional problem. Therefore, for any given data analytics framework––whether open source or licensed––we at least expect it to be visually smart, fast, platform-agnostic, with on-cloud demand, and supported with minimum domain features.
I started looking for such a framework to work with the Automatic Information System (AIS) vessel traffic dataset as part of my data mining class project. AIS location data are generated every six minutes by every ship moving or anchored around the United States. The AIS dataset is really big (billions and billions of records) and gets really messy, especially if you decide to do more advanced analysis like what I was planning to do: trajectory reconstruction, route prediction and anomaly detection in different scenarios. I decided to use almost eight years of AIS data for the whole of the United States; given how many tugboats, cargo ships, passenger ships and fishing vessels operate every single day, you can imagine how big an eight-year dataset is.
There were multiple reasons for using such a large dataset: primarily, the machine learning models that I was using give better results with more data, and my problems were defined for a large geospatial area. However, I needed the complete data analysis pipeline to do anything meaningful, and therefore I started exploring the Omnisci framework, which offered not only the important features I was looking for but also various integration of databases and a visual framework. Having a strong tech support team to help me was an extra advantage.
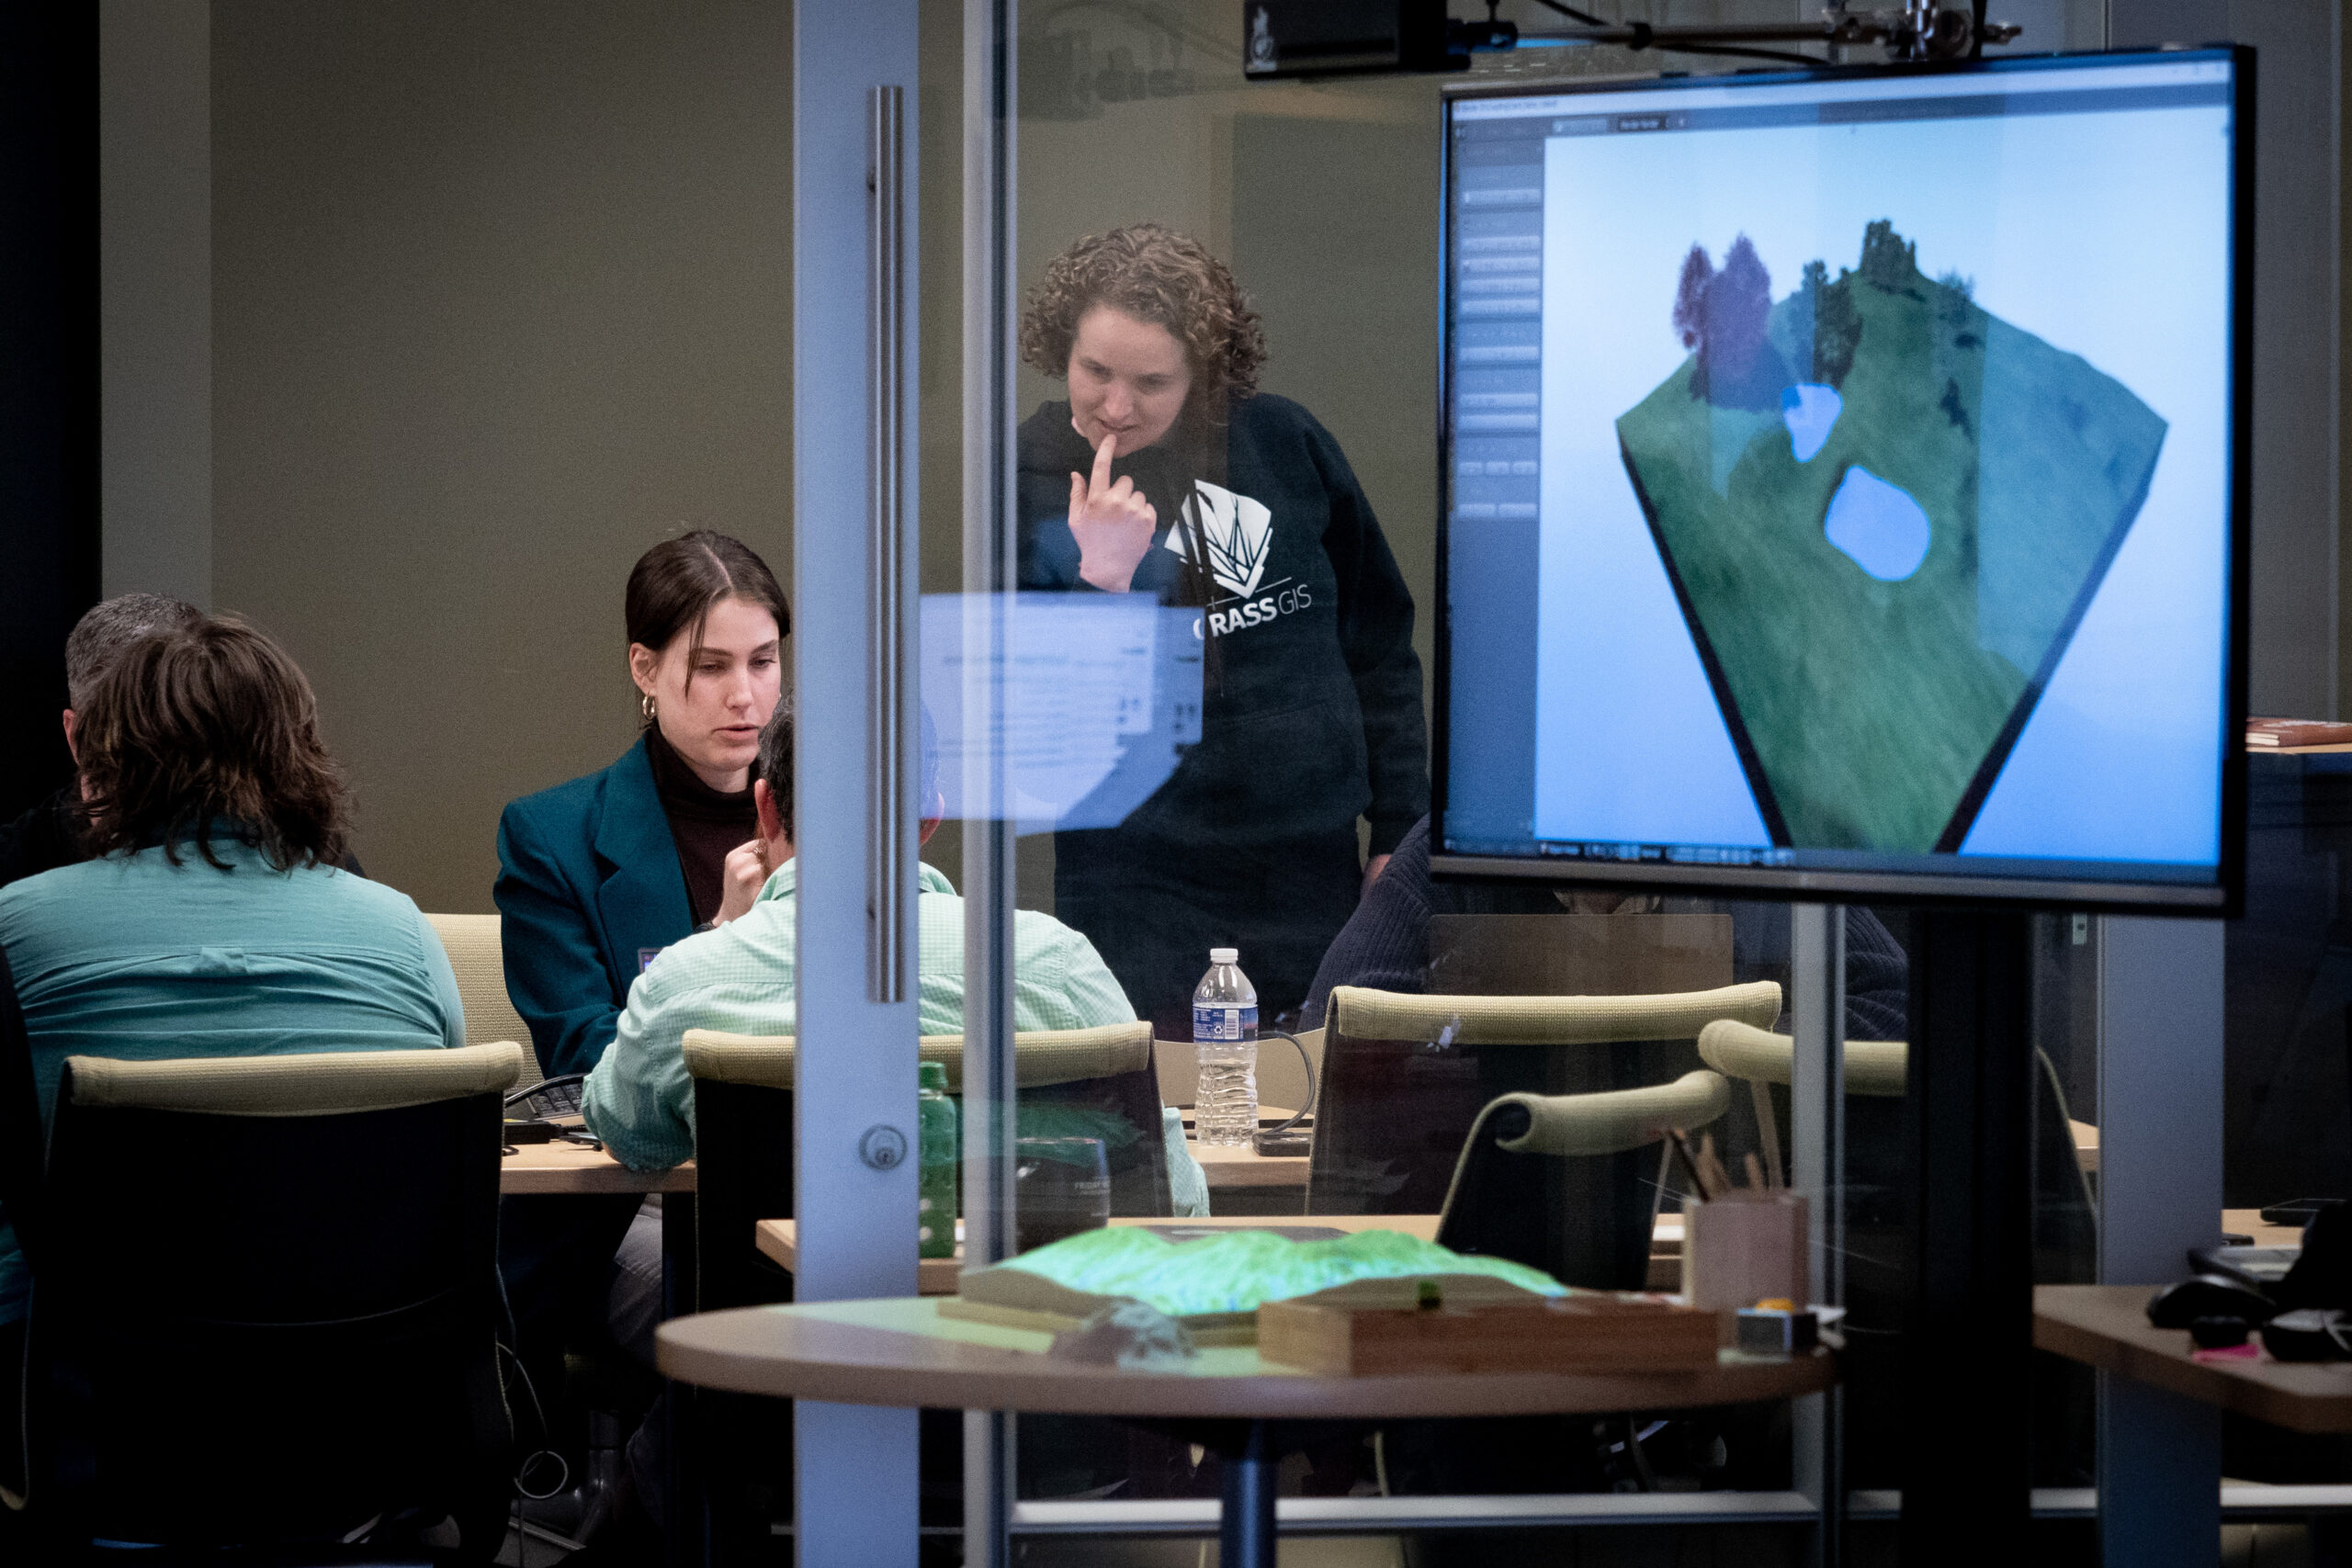
I started using Omnisci Core-DB, which is fully open source, and I was happy to see the speed it offered on my local machine. I was able to load the whole dataset and perform real-time analysis for validation of my results. I was also offered a student license to use the cloud service that comes with OmniSci Immerse, the smart visual analytics framework. With Immerse, I was able to dive deeper into my analysis and actually capture the validations right on the map.
A visualization I created based on my analyses––“Live Vessel Density Map”––was awarded second place in the postdocs and grad students category of the 2019 NC State Envisioning Research competition.
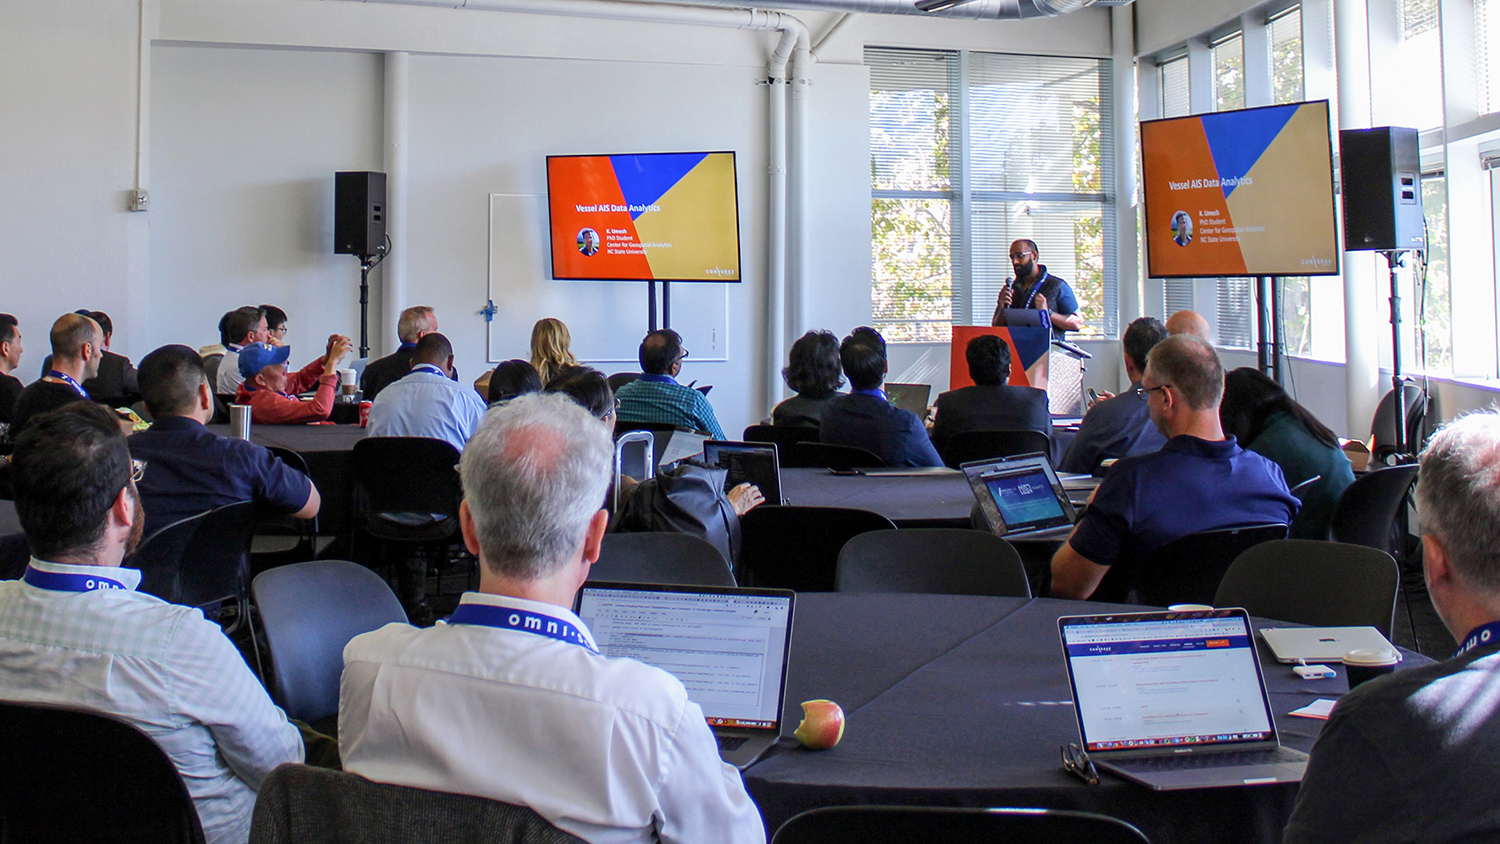
Being excited about high-performance computing and geospatial analysis, I was happy to see how Omnisci is able to leverage data analytics with advanced architectures and fast databases. Last October, I attended Converge, the inaugural conference organized by Omnisci in California. I was able to learn so much more about different industries, academia and government using Omnisci’s framework for critical analysis at Converge 2019, and I was invited to speak about my work. It was exciting to be recognized to present my class project to the larger data science community and, more importantly, to receive feedback from core developers. Other presentations I attended were equally important for me to learn not only about new case studies but also how uniquely each of them has used different data analysis frameworks.
This work was motivated by the AIS work available on the Omnisci website. I thank my advisors, Dr. Gray, Dr. Mitasova, Dr. Vatsavai and Dr. Meentemeyer for this work. I thank the Center for Geospatial Analytics for funding my travel.
- Categories: