New Visualization Tool Helps Weather Forecasters and Researchers More Easily Identify and Study Bands of Heavy Snow

Predicting snowfall from winter storms is tricky, in no small part because heavy snow and regions of mixed precipitation look very similar in weather radar imagery. Mixed precipitation falls as a blend of rain, freezing rain, sleet and snow and can be mistaken for heavy snow on radar imagery, while translating to less snow accumulation on the ground.
Info about the consistency of precipitation particles’ shapes and sizes, derived from weather radar, can help meteorologists distinguish between uniform and mixed precipitation, but visualizing that consistency info has traditionally been difficult, especially as precipitation features within a winter storm move in complicated ways, shifting through time and traveling with prevailing winds across a landscape.
To address this problem, researchers at North Carolina State University developed a new way to seamlessly integrate standard weather radar imagery and information about precipitation type, so that weather forecasters and atmospheric scientists can quickly and easily distinguish heavy snow from mixed precipitation and improve understanding of the dynamics of winter storms.
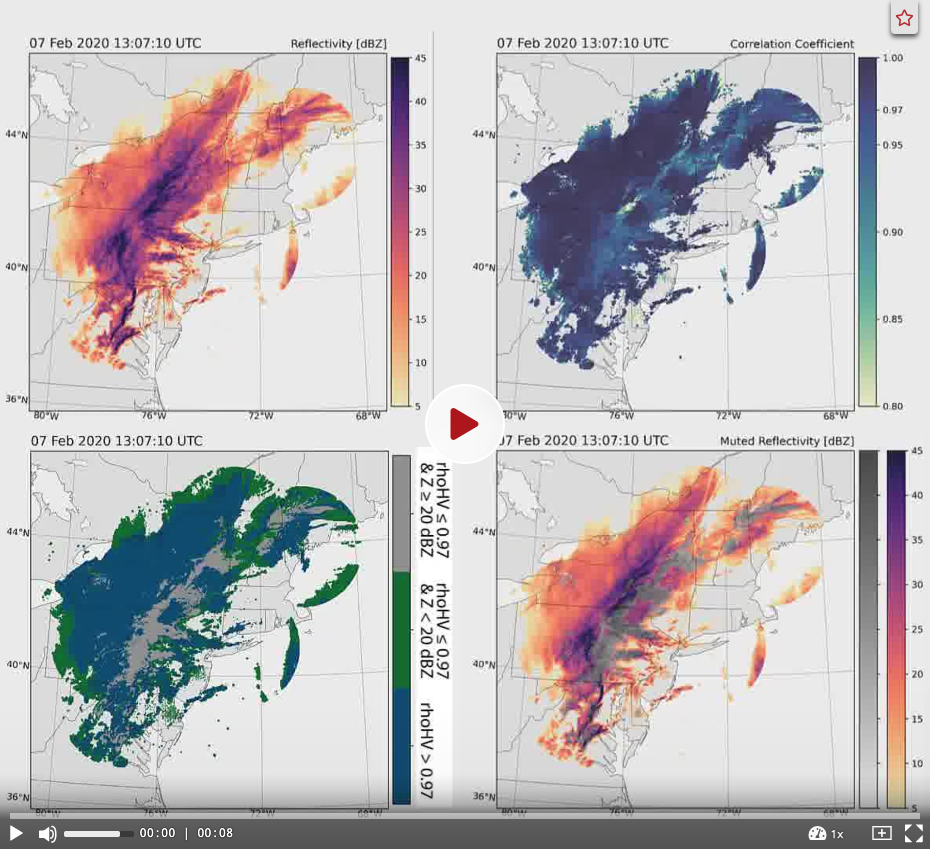
The new technique, called “image muting,” reduces the visual prominence of mixed precipitation in moving radar images, thereby making areas of only snow or only rain more obvious. For scientists who study snowfall from winter storms, image-muting helps ensure they are “analyzing the right features,” explains Laura Tomkins, a doctoral candidate at NC State’s Center for Geospatial Analytics and lead author of the study. Her new method relies on integrating two sources of information into one visual display, in this case, radar reflectivity and correlation coefficient.
“Reflectivity” (measured in decibels, dBZ) indicates the intensity of precipitation detected by radar, with higher reflectivities corresponding to heavier rain, snow, etc. Correlation coefficient values indicate the consistency of the shapes and sizes of precipitation particles within a storm; areas of only rain or only snow have a correlation coefficient of approximately 1, while areas of mixed precipitation types have lower values.
Reflectivity and correlation coefficient values, though, are usually mapped as separate products. “The way it works right now is that forecasters flip back and forth between reflectivity and correlation coefficient to see where the mixed precipitation is,” Tomkins says. While switching repeatedly between maps is burdensome enough, “keeping track of changing shapes of moving objects is particularly challenging,” she and her co-authors explain.
To reduce the burden of mentally comparing reflectivity and correlation coefficient values as storms change through space and time, Tomkins and her team created a way to identify areas of a winter storm that have values characteristic of mixed precipitation (reflectivity greater than 20 dBZ and correlation coefficient less than 0.97). They then changed how these areas appear in standard moving reflectivity maps, setting them to a gray scale while the rest of the map remains in a color-blind-friendly color scale that indicates precipitation intensity (see lower right panel in the video below). “We didn’t want to get rid of melting [from the map] altogether, just reduce its visual prominence,” Tomkins says. “It gives us the confidence to say, we know this is not heavy snow, because it’s contaminated with melting.”

“Weather forecasters are interested in how much snow is going to fall and when, but mixed precipitation is dangerous too,” Tomkins explains. Hence the importance of simply muting mixed precipitation with a gray scale, rather than removing it from the map. Her technique, developed specifically for analyzing snowfall during winter storms, will help atmospheric scientists better understand “where snow bands occur and why, and [that research will] trickle down into improving snowfall forecasts,” she says. “We designed this for our own snow analysis but it also has potential applications for weather forecasters.”
For the average person checking weather maps to plan their day, Tomkins says image-muting would help them better understand where and when to expect transitions from rain and sleet to snow. “It might be raining now,” she says, “but will it transition to snow?” Notably, her method uses information about the precipitation particles measured by the radar, rather than observations of temperature, which are typically used to infer precipitation type in weather maps.
As a visualization technique, image-muting can be used in other research applications, such as reducing the visual prominence of data associated with high uncertainty, and Tomkins and her team have made their method freely available for others to use. The functions that enable making image-muted maps were included in the version 1.11.8 release of the Python Atmospheric Radiation Measurement (ARM) Radar Toolkit (Py-ART), an open-source Python package developed by the Department of Energy. An example of how to use the function is available online.
The study, “Image muting of mixed precipitation to improve identification of regions of heavy snow in radar data,” was published in Atmospheric Measurement Techniques and co-authored by Sandra Yuter (faculty fellow, Center for Geospatial Analytics; distinguished professor, Department of Marine, Earth and Atmospheric Sciences), Matthew Miller (senior research scholar, Department of Marine, Earth and Atmospheric Sciences) and Luke Allen (doctoral candidate, Center for Geospatial Analytics).


