Using Machine Learning to Map Floods
If it seems like certain places suffer from worse flooding these days, it’s because they do.
Natural disasters have always tended to hit certain communities harder — often those already at a disadvantage, by design — and climate change has only intensified the problem, especially for big cities. Several aspects of urban areas make it more difficult to map where flooding occurs. So, in comparison to rural areas, urban areas have historically been understudied.
Modern-day emergency planners need tools to more accurately predict — and better prepare for — flooding in urban areas. A graduate student at NC State University’s Center for Geospatial Analytics has trained a machine-learning model to create maps that could someday help them do just that.
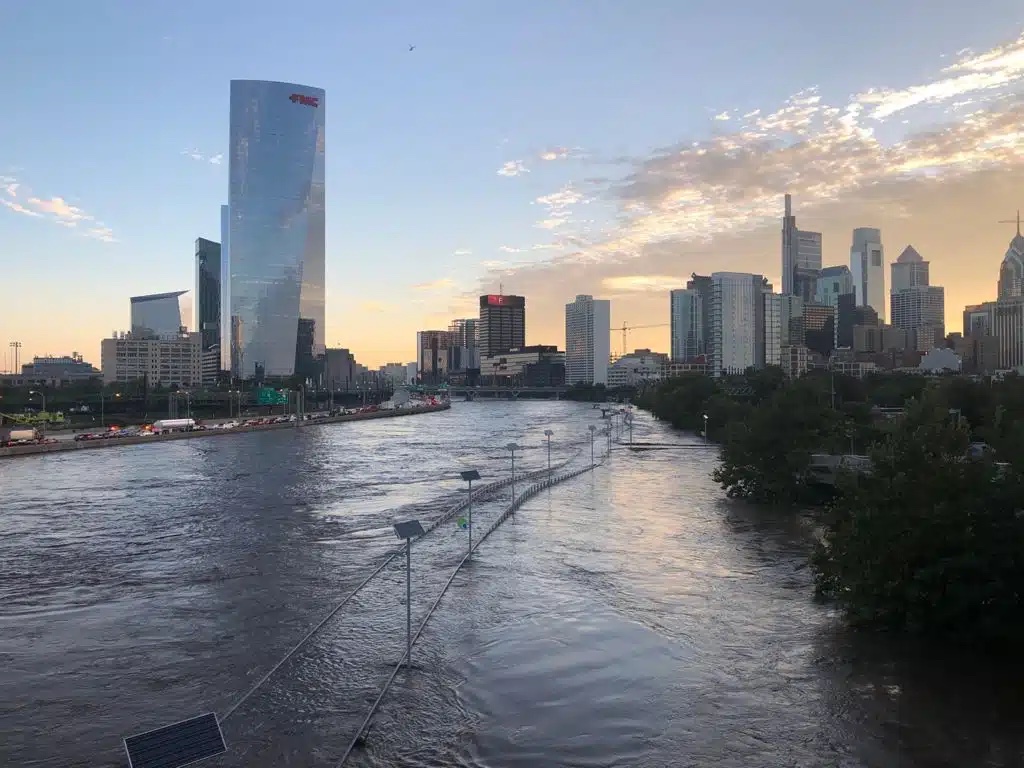
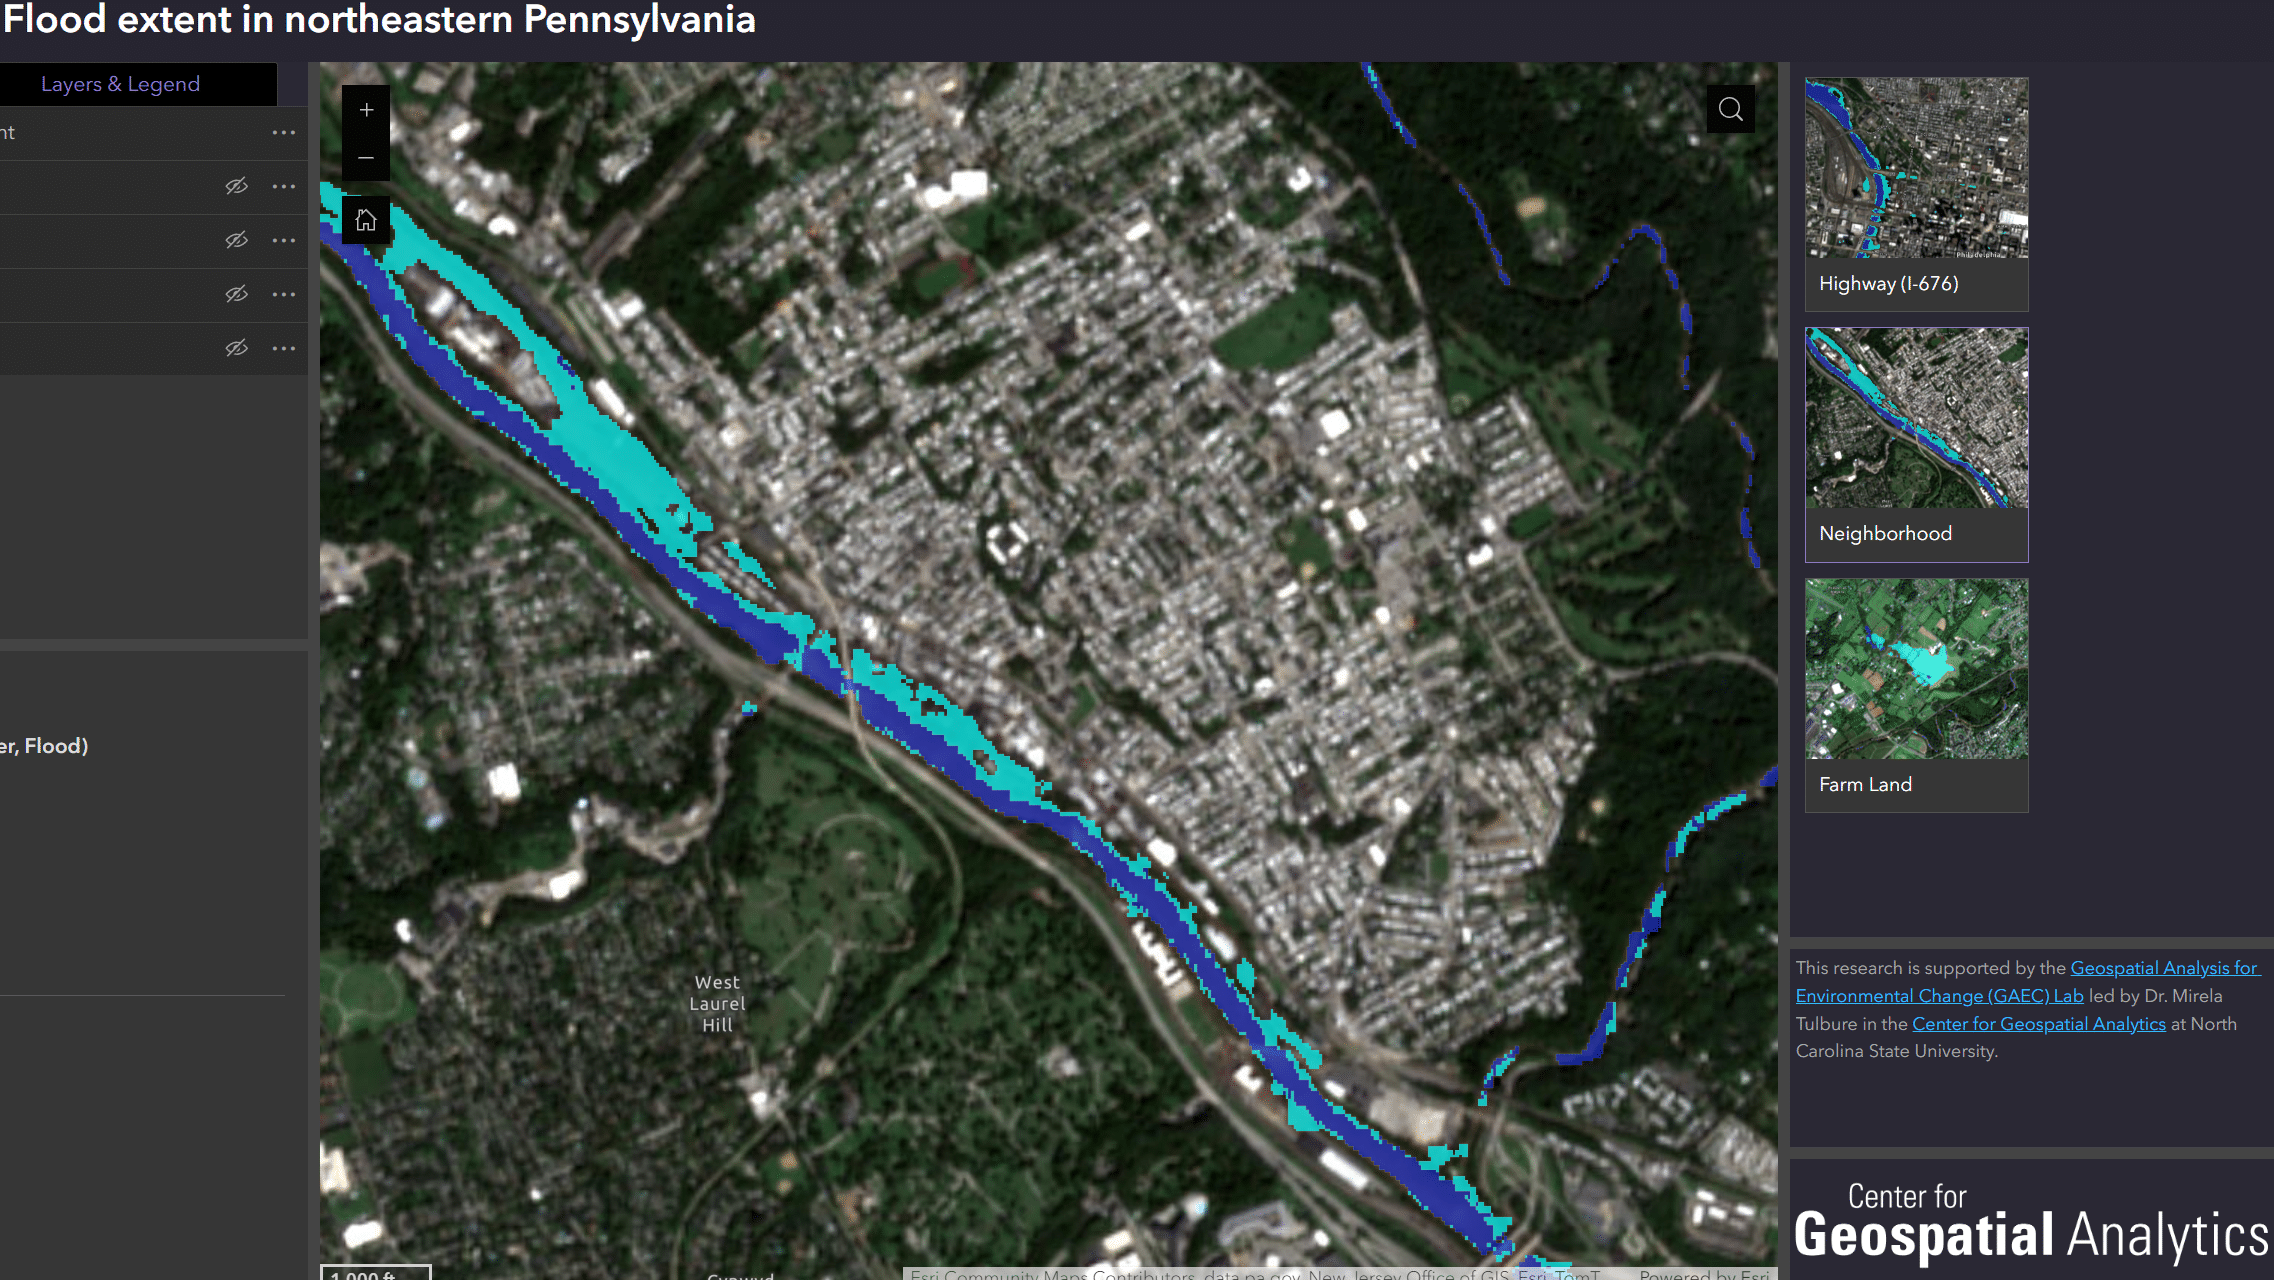
Based on open-source satellite images captured during Hurricane Ida, Rebecca Composto developed a mapping tool that could help identify potentially flood-prone areas in urban settings — and empower officials with the information needed to make better decisions about where to allocate flood response and prevention resources.
Composto says that compared to rural communities, urban areas present unique challenges in collecting satellite data and tracking water flow.
For one, flooding in urban areas tends to start and end quickly — sometimes too quickly for satellites to gather enough usable data.
Meanwhile, a sea of skyscrapers, streets and sidewalks doesn’t make things any easier.
“Taller buildings create more shadows, which means that the satellite imagery appears darker and carries less information,” says Composto, who’s working toward a Ph.D. in geospatial analytics. “Urban areas also have more complex hydrology, as the existence of so many drainage systems along with concrete surfaces that don’t soak up water means that it’s harder to predict where water accumulates.”
With Mirela G. Tulbure, a Center for Geospatial Analytics Faculty Fellow and professor in NC State’s College of Natural Resources, postdoctoral researcher Júlio Caineta, graduate research assistant Varun Tiwari and fellow geospatial analytics Ph.D. candidate Mollie D. Gaines, Composto recently published a paper, “Quantifying urban flood extent using satellite imagery and machine learning,” in the journal Natural Hazards.
Future research could focus on making the model easier to use, Composto says. She also plans to integrate a new map displaying flood depth — and make her code open source so it’s easier to share with emergency-response leaders.
This article was originally published in NC State News. A news release was also published in NC State News.