Natural Gas Pipeline Density Higher Overall in More Vulnerable U.S. Counties
For Immediate Release
An analysis led by North Carolina State University researchers found counties with more socially vulnerable populations had a higher density of natural gas pipelines overall.
The findings suggest counties that are more socially vulnerable are also at greater risk of facing water and air pollution, public health and safety issues, and other negative impacts associated with the pipelines.
“We know that the network, as it stands today, is already distributed in such a way that any negative impacts fall disproportionately on vulnerable communities,” said the study’s lead author, Ryan Emanuel, a professor of forestry and environmental resources at NC State. “Right now, when regulators evaluate the social impacts of these projects, they are treated in isolation, and not as part of a massive network that affects more than 70 percent of all the counties in the U.S.”
In the analysis, researchers used a measure of social vulnerability created in 2018 by the U.S. Centers for Disease Control and Prevention to assess 3,142 U.S. counties. The index combines information on household composition, age, disability status, race or ethnicity, language, and other factors to quantify a county’s ability to bounce back from a disaster.
Then, using data from the U.S. Energy Information Administration, researchers evaluated how the approximately 229,000 miles of pipeline network in the United States mapped on top of counties, stratified by their social vulnerability scores.
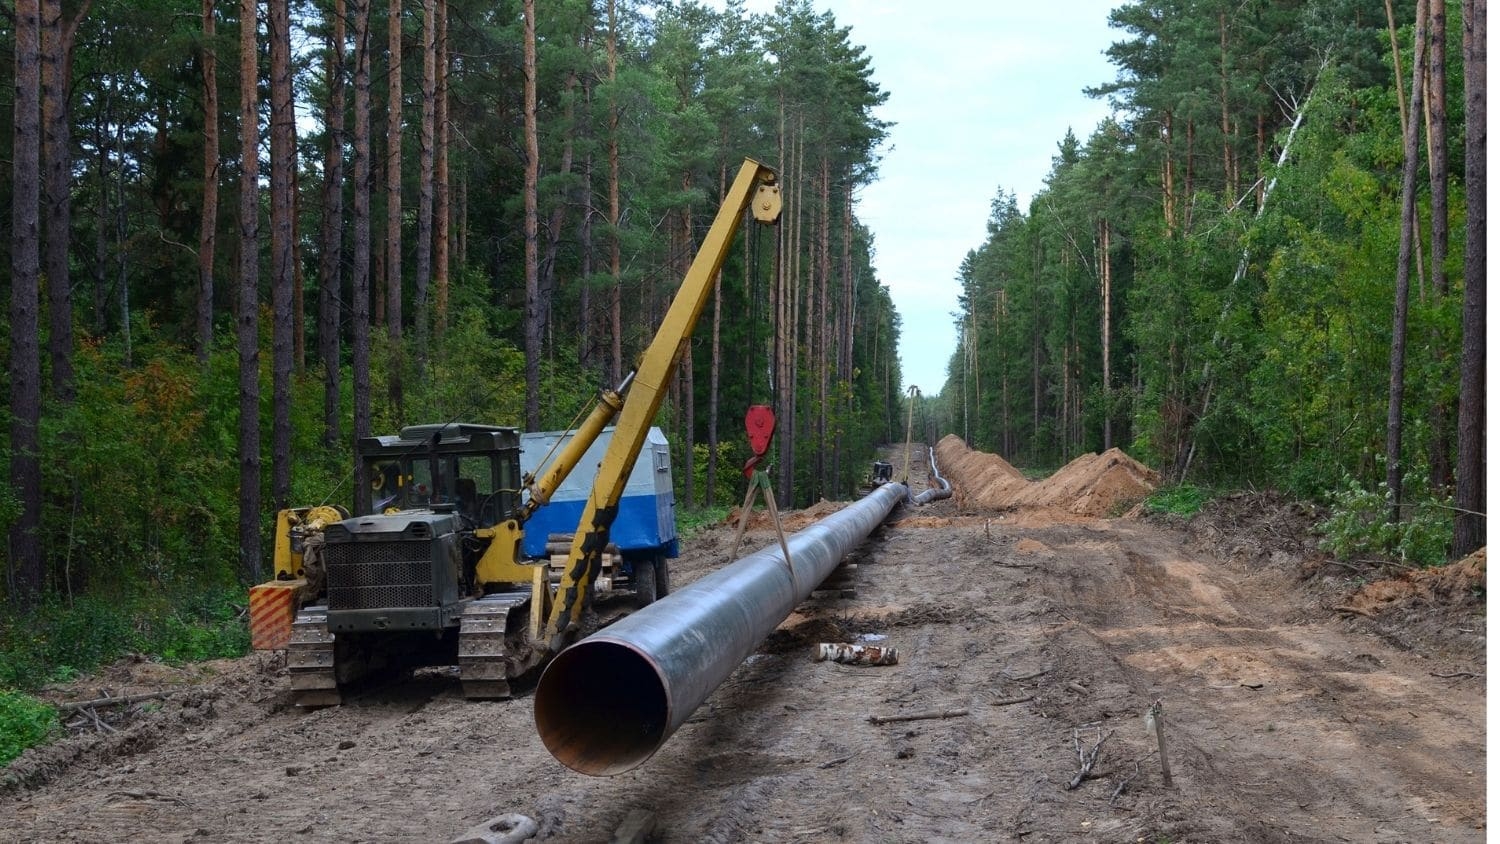
“We studied the gas gathering and transmission pipelines, which are the really large and high-pressure pipelines that are meant to transport natural gas across regions or the country,” Emanuel said. “We know that every year, there are explosions on transmission pipelines, and we have records for those accidents above a certain size. There are also air quality impacts at compressor stations that power them, and environmental damages that occur during construction.”
For the 2,261 counties with pipelines in them – about 72 percent of U.S. counties – researchers found a correlation between counties with higher scores of social vulnerability, and the density of pipeline infrastructure.
“In general, the denser the pipeline network, the higher the social vulnerability score,” said study co-author Louie Rivers III, associate professor of forestry and environmental resources at NC State. “The indication is the most vulnerable populations are also vulnerable to exploitation in terms of what people do with the land near them.”
For planning the path of future projects, researchers say more nuance is needed in the regulatory process to evaluate communities. While population density is used as a factor used by regulators in assessing the severity of negative impacts of pipelines, density alone could overlook ways in which rural communities may be more vulnerable.
“When you evaluate the pipeline project for a rural area, you can’t just assume that the concerns of a rural community are just going to be low-density versions of urban concerns,” Emanuel said. “Rural issues are not less intense versions of urban issues. We also know from past research that these projects can have a destabilizing influence on rural communities.”
Researchers also highlighted impacts of pipeline infrastructure on Indigenous communities in the U.S. They noted the Dakota Access, Keystone XL, Trans Mountain expansion and Enbridge Line 3 pipelines cross, or are proposed to cross, Indigenous territories in the U.S. and Canada. This raises concerns for communities about not only pollution or risks for health, but also for cultural harm to places with religious, historical or cultural significance.
The researchers pointed to the need to improve environmental assessments of potential pipeline infrastructure on vulnerable populations to prevent these networks from disproportionately impacting socially vulnerable people. They also called for better inclusion of community perspectives into decision-making.
“We need the same level of rigor applied to the issue of environmental justice in environmental impact statements as we see for other sections, such as water and air quality,” Rivers said.
And while the existing infrastructure may have been built before federal policies were enacted to address environmental justice and antidiscrimination, researchers said federal regulators specifically need to assess the location of infrastructure networks as a whole in future planning to avoid reinforcing historic oppressive practices. They also suggested assessing the cumulative impacts of all nearby infrastructure on factors such as air quality, noise and explosion risks.
“We need a comprehensive approach to environmental justice analyses that considers the larger network of infrastructure in which individual projects exist,” Emanuel said.
The study, “Natural Gas Gathering and Transmission Pipelines and Social Vulnerability in the United States,” was published open access in the journal GeoHealth. The paper was co-authored by Martina Angela Caretta of Lund University and Pavithra Vasudevan at the University of Texas at Austin.
-oleniacz-
Note to editors: The abstract follows.
“Natural Gas Gathering and Transmission Pipelines and Social Vulnerability in the United States.”
Authors: Ryan E. Emanuel, Martina Angela Caretta, Louie Rivers III and Pavithra Vasudevan.
DOI: 10.1029/2021GH000442
Published online in GeoHealth May 18, 2021.
Abstract: Midstream oil and gas infrastructure comprises vast networks of gathering and transmission pipelines that connect upstream extraction to downstream consumption. In the United States (US), public policies and corporate decisions have prompted a wave of proposals for new gathering and transmission pipelines in recent years, raising the question: Who bears the burdens associated with existing pipeline infrastructure in the US? With this in mind, we examined the density of natural gas gathering and transmission pipelines in the US together with county-level data on social vulnerability. For the 2,261 US counties containing natural gas pipelines, we found a positive correlation between county-level pipeline density and an index of social vulnerability. In general, counties with more socially vulnerable populations have significantly higher pipeline densities than counties with less socially vulnerable populations. In particular, counties in the top quartile of social vulnerability tend to have pipeline densities that are much higher than pipeline densities for counties in the bottom quartile of social vulnerability. The difference grows larger for counties at the upper extremes of pipeline density within each group. We discuss some of the implications for Indigenous communities and others affected by recent expansions of oil and gas infrastructure. We offer recommendations aimed at improving ways in which decision-makers identify and address the societal impacts and environmental justice implications of midstream pipeline infrastructure.
- Categories: